We have recorded indoor temperatures for each unit April 1 through Sept. 30 of 2022, 2023, 2024 and 2025. According to the Texas Department of Criminal Justice, indoor temperatures are taken at 3 p.m. every day from April through September at all units that do not have air conditioning. The data was acquired by Lauren McGaughy at KUT through a public information request to the Texas Department of Criminal Justice. All temperatures are recorded in Fahrenheit.
Goals of this notebook
In this notebook, we will explore the following questions:
What was the highest temperature reached each year, and where?
How many days was the indoor temperature at least X degrees (85, 90, 95, 100+) each year from 2022 to 2025?
Which units consistently recorded the highest temperatures?
How many consecutive days in those measures? (Not tackled yet)
Setup, import and preparation
Click to show code
# Loading our librarieslibrary(tidyverse)library(janitor)library(ggthemes)library(DT)library(ggwaffle)# suppress group warningoptions(dplyr.summarise.inform =FALSE)# Reading in the cleaned and combined indoor logs.indoor_logs_clean <-read_rds("data-processed/01-indoor-temps-all-cleaned.rds")# Adding variables to help analysis by date.indoor_logs <- indoor_logs_clean |>mutate(flo_mo =floor_date(date, unit ="month"),year =year(date))
Records per unit, year
Checking where we might have missing data … Here we show the year without 183 recorded days in red so you can see them.
Data takeaway: For each year, we have 183 total days of indoor temperature recordings. For each year of data, there are 68 TDCJ units that recorded indoor temperatures. However, the units recorded differ by year, with 74 total units appearing across all four years of data. Sixty-three units appear in all four years of data. The 11 units that differ by year are as follows:
Bartlett: 2025 only, April, May, June and July only (does not appear in August or September data)
Baten: 2025 only
Garza East: 2024 and 2025 only
Gurney: 2025 only
Johnston: 2022 and 2023 only
Mountain View: 2022 and 2023 only
O’Daniel: 2024 only (note: the Mountain View unit was renamed to Patrick O’Daniel in January 2024, which appears as O’Daniel in the data. They are the same unit.)
Plane: 2022, 2023 and 2024 only
Sayle: appears in 2022 only
Segovia: 2023 (June, July and August and September only), 2024 and 2025 only
Young: 2022, 2023 and 2024 only
Hottest temps each year
The top 10 hottest days indoors for each year.
Click to show code
indoor_logs |>group_by(year) |>slice_max(temperature, n =10) |>select(year, unit, date, temperature)
Summarizing how many times each unit appears in the top 10 hottest temperature recordings each year.
Click to show code
indoor_logs |>group_by(year) |>slice_max(temperature, n =10) |>select(year, unit, date, temperature) |>group_by(unit, year) |>summarize(n =n()) |>arrange(desc(n))
Note - several years include more than 10 recordings for the top 10 because of days/units where the temperature recorded was the same.
Data takeaways:
For 2022, 2023 and 2024, the 10 hottest indoor temperatures recorded each year exceeded 101 degrees across all units. In 2025, the 10 hottest temperatures fell between 100 and 98.5 degrees.
The units that appeared in the 10 hottest recordings each year largely varied, with the exception of Garza West in 2025, which made up 10 of the 13 recordings.
Data takeaway: It reached 100 degrees indoors 211 times across all units between 2022 and 2025, 108 of which occurred in 2023. Twice, it reached 105 or above. The hottest temperature across all years was recorded at the Mountain View unit on June 19, 2023, which reached 106.8 degrees. The Mountain View unit was renamed to Patrick O’Daniel (appears as O’Daniel in the data) in January 2024 and houses female prisoners in Gatesville, Texas, about 45 miles west of Waco. It houses up to 644 prisoners at full capacity.
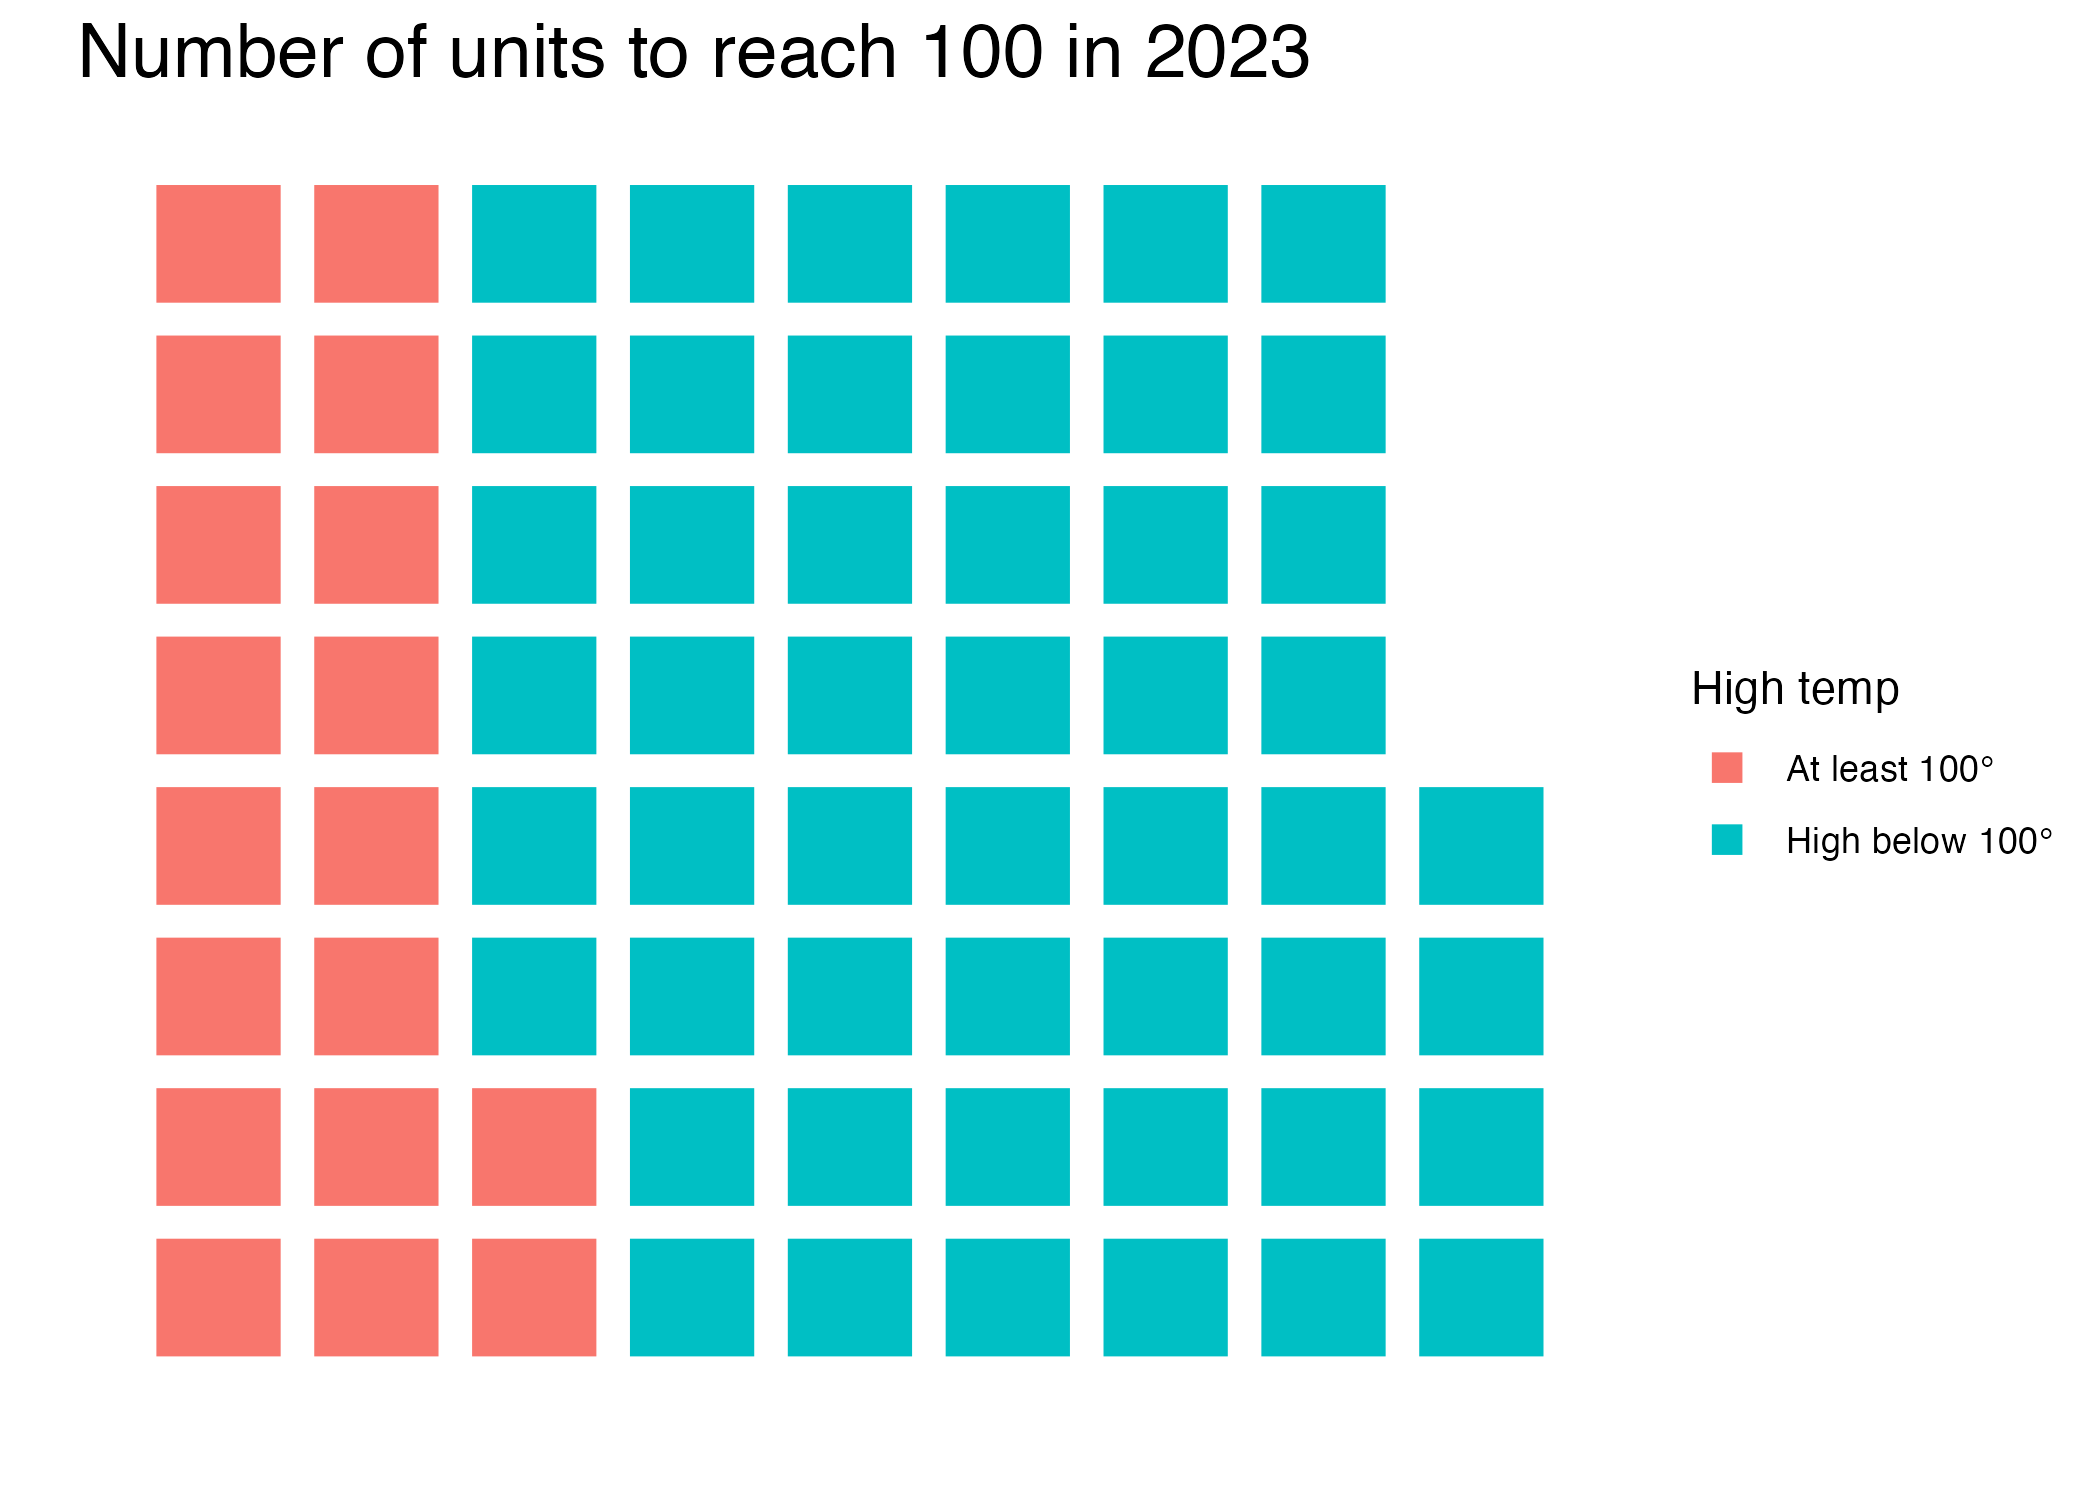
Reaching 100 in 2023
It reached 100 degrees more than 100 times in 2003.
Click to show code
days100 |>filter(year ==2023)
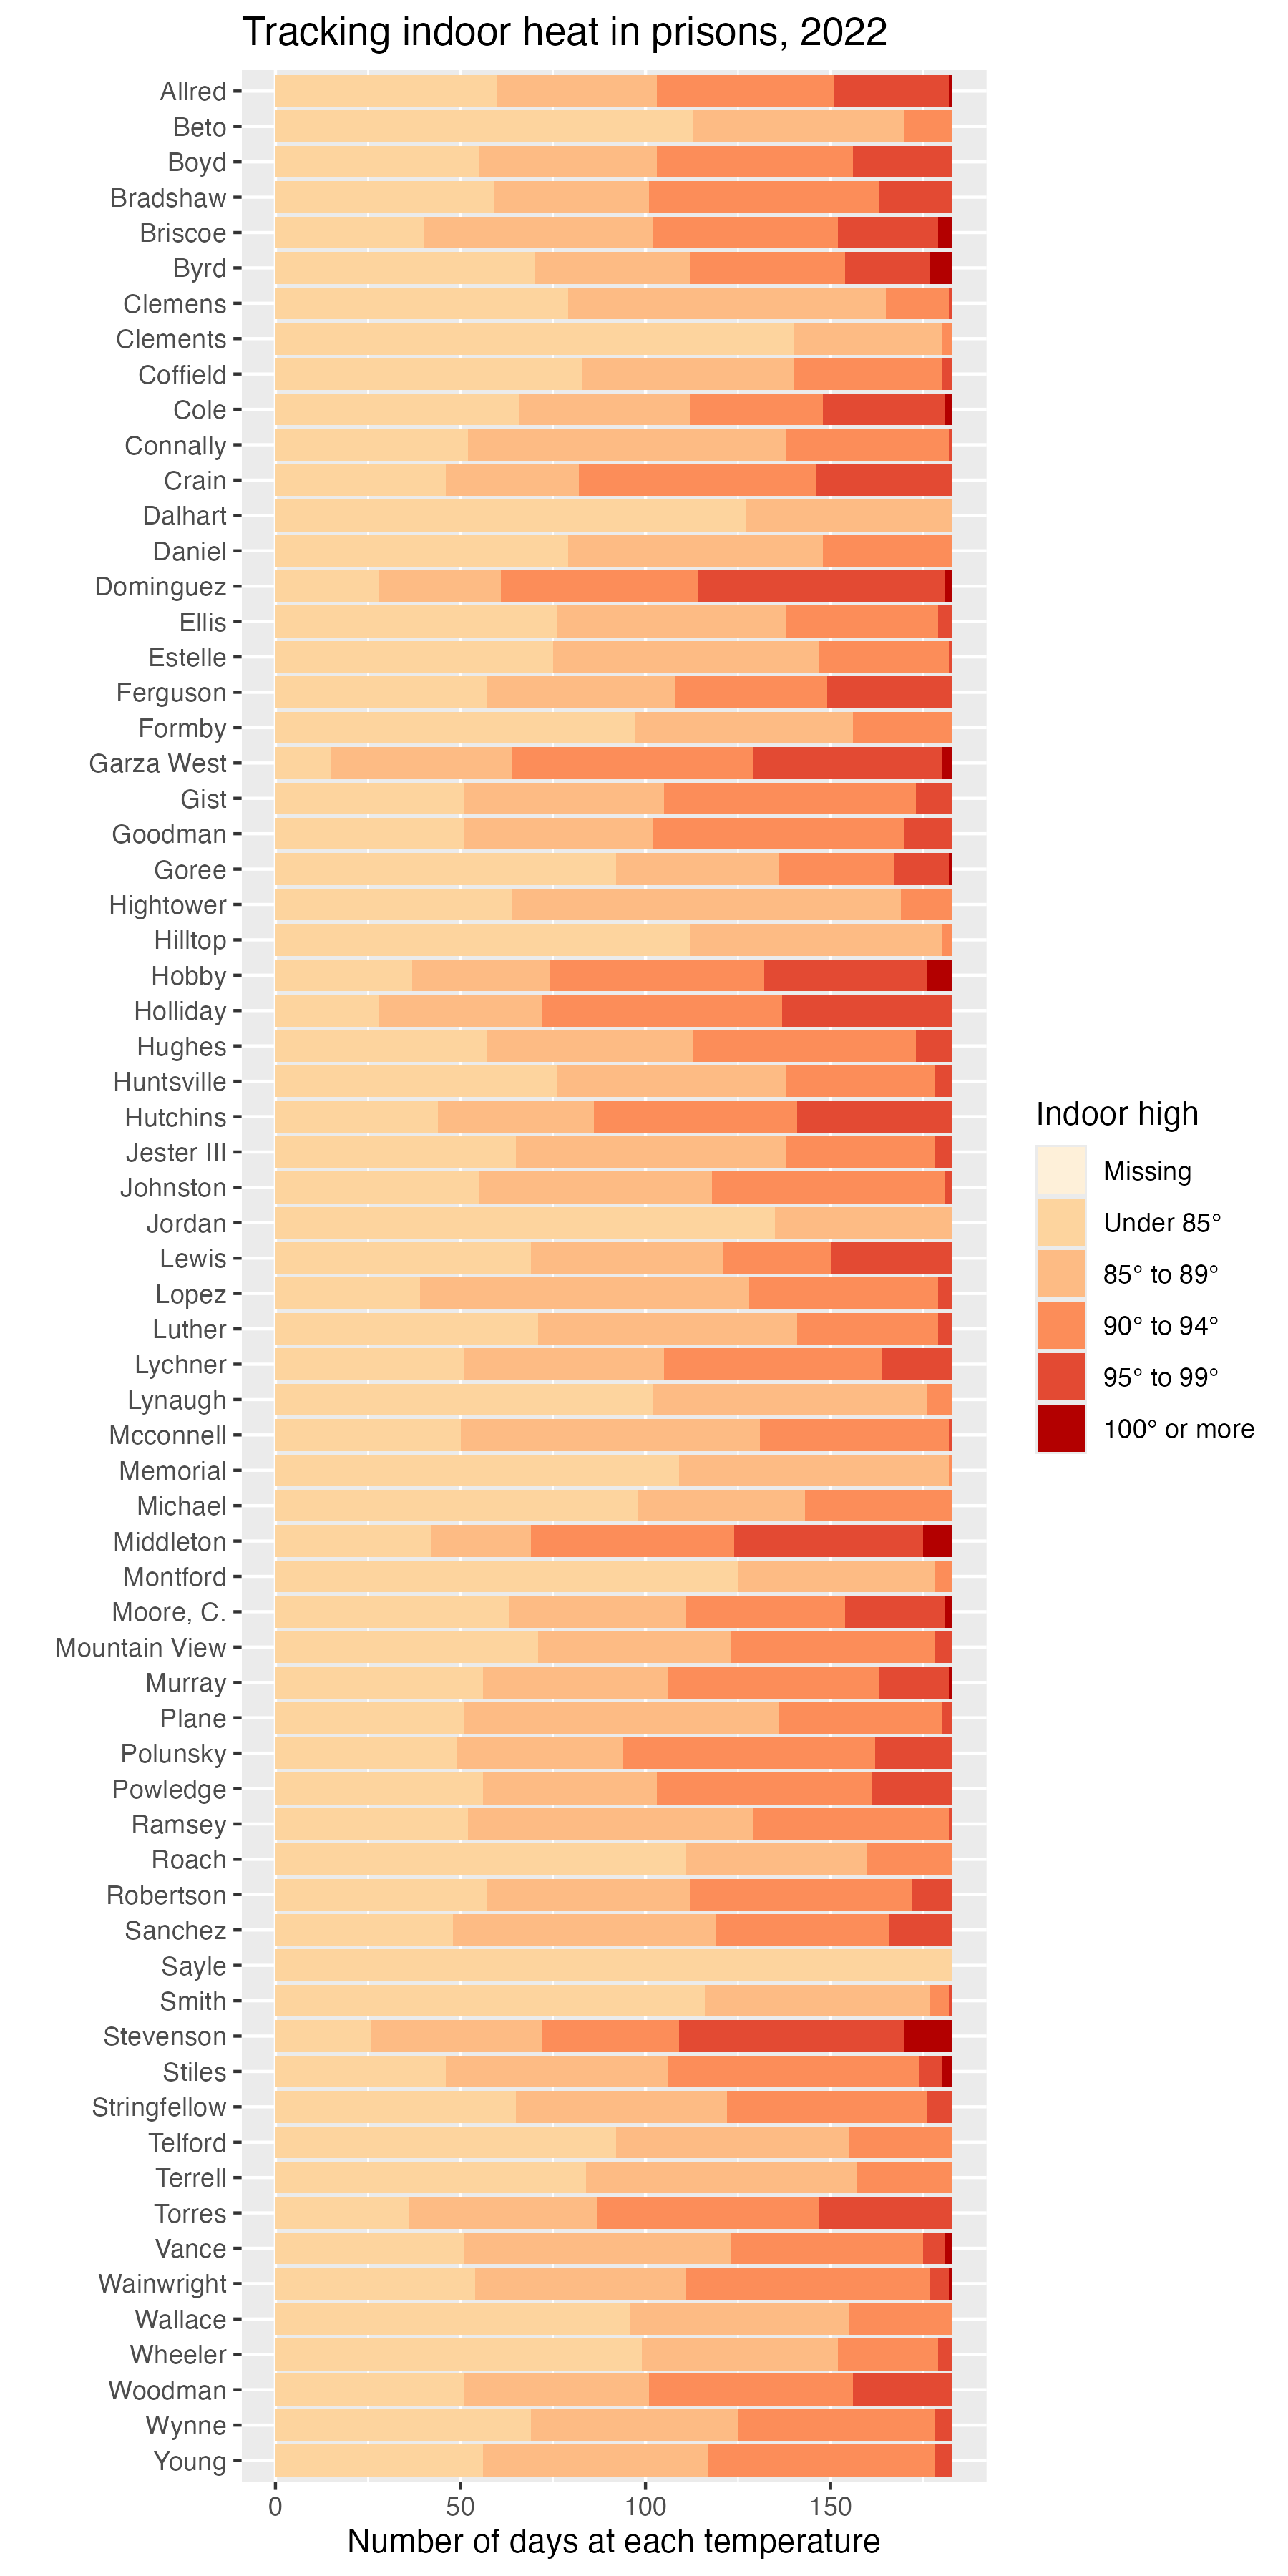
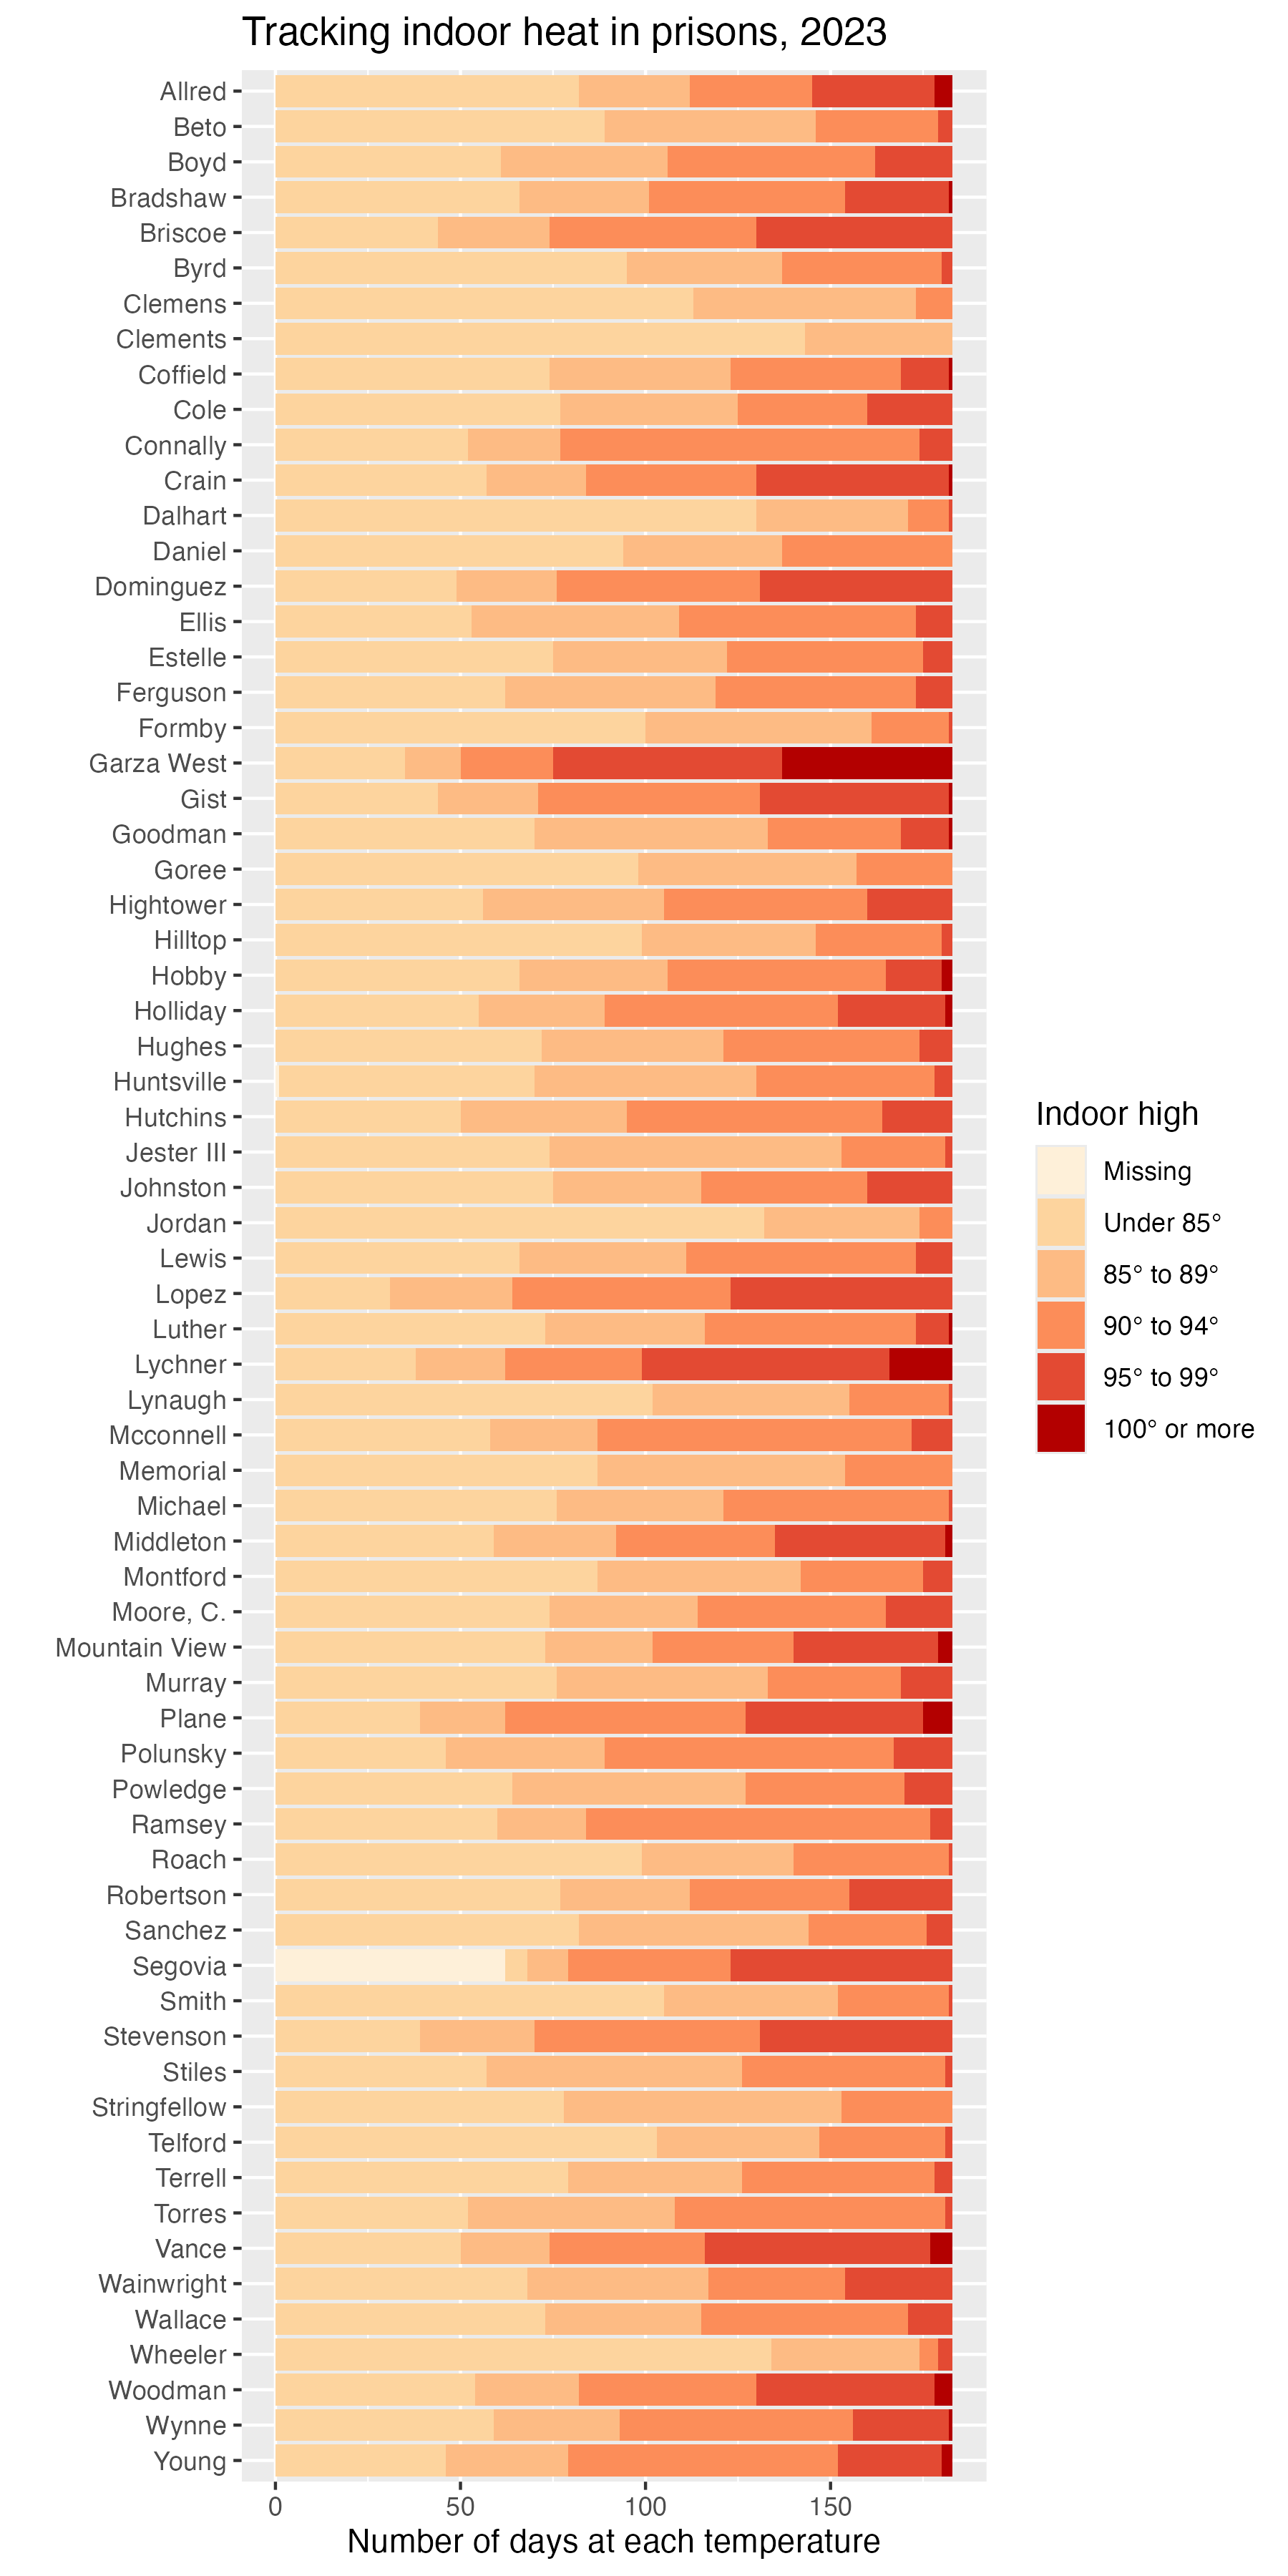
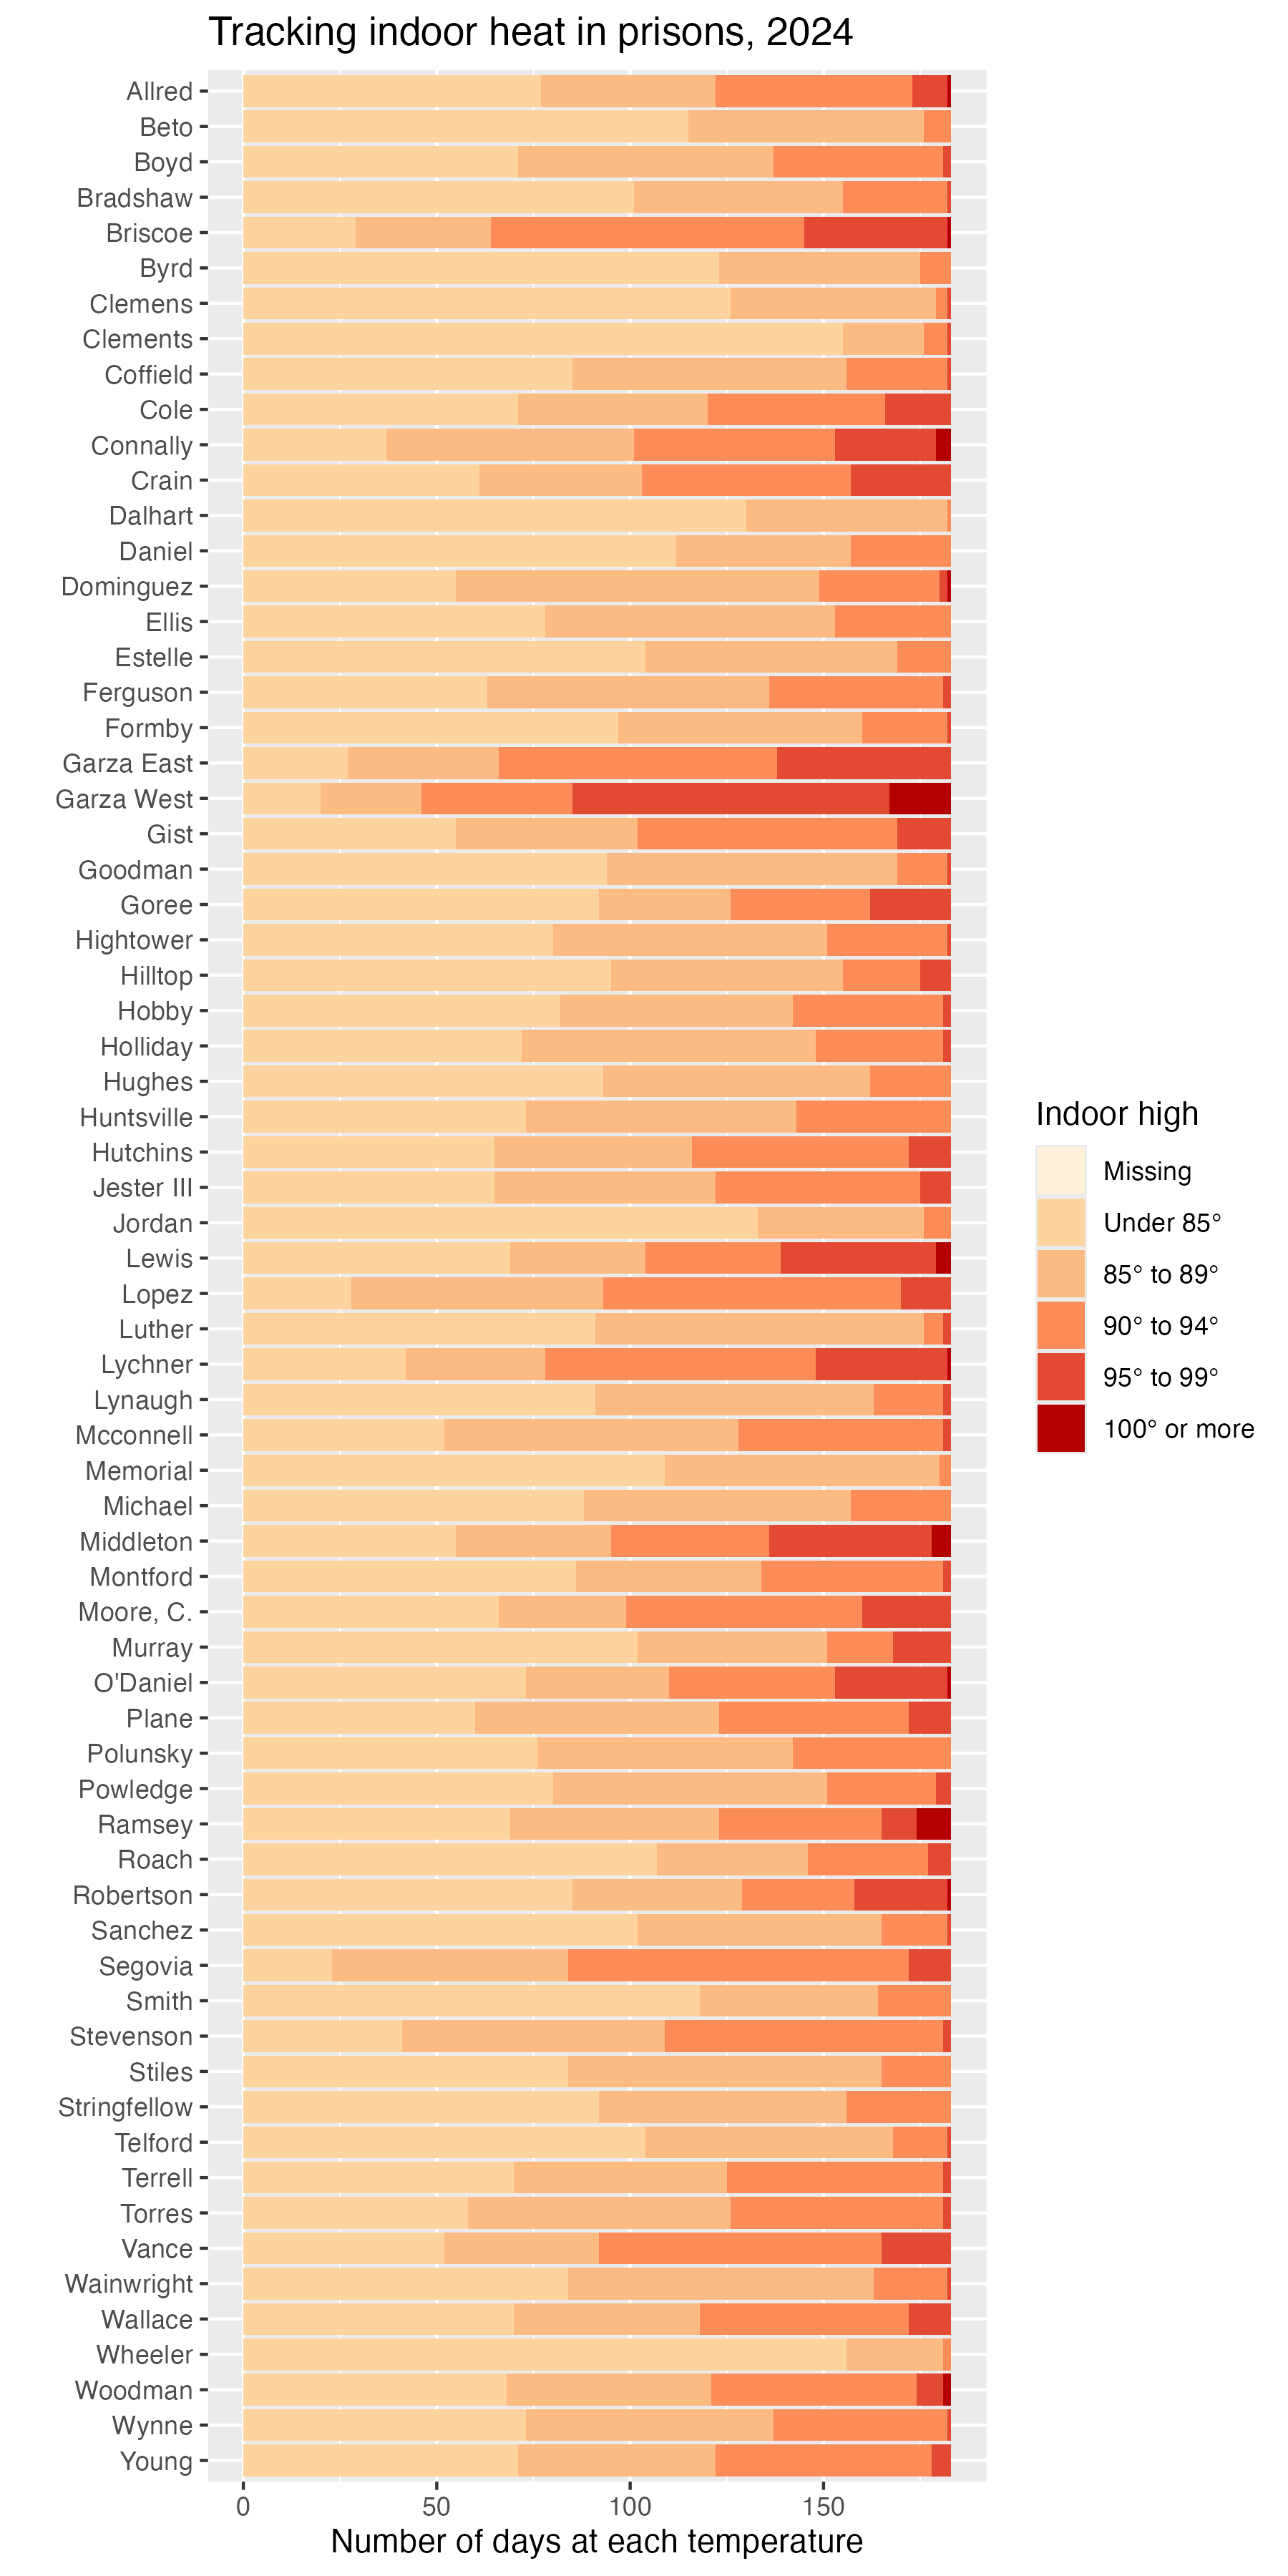
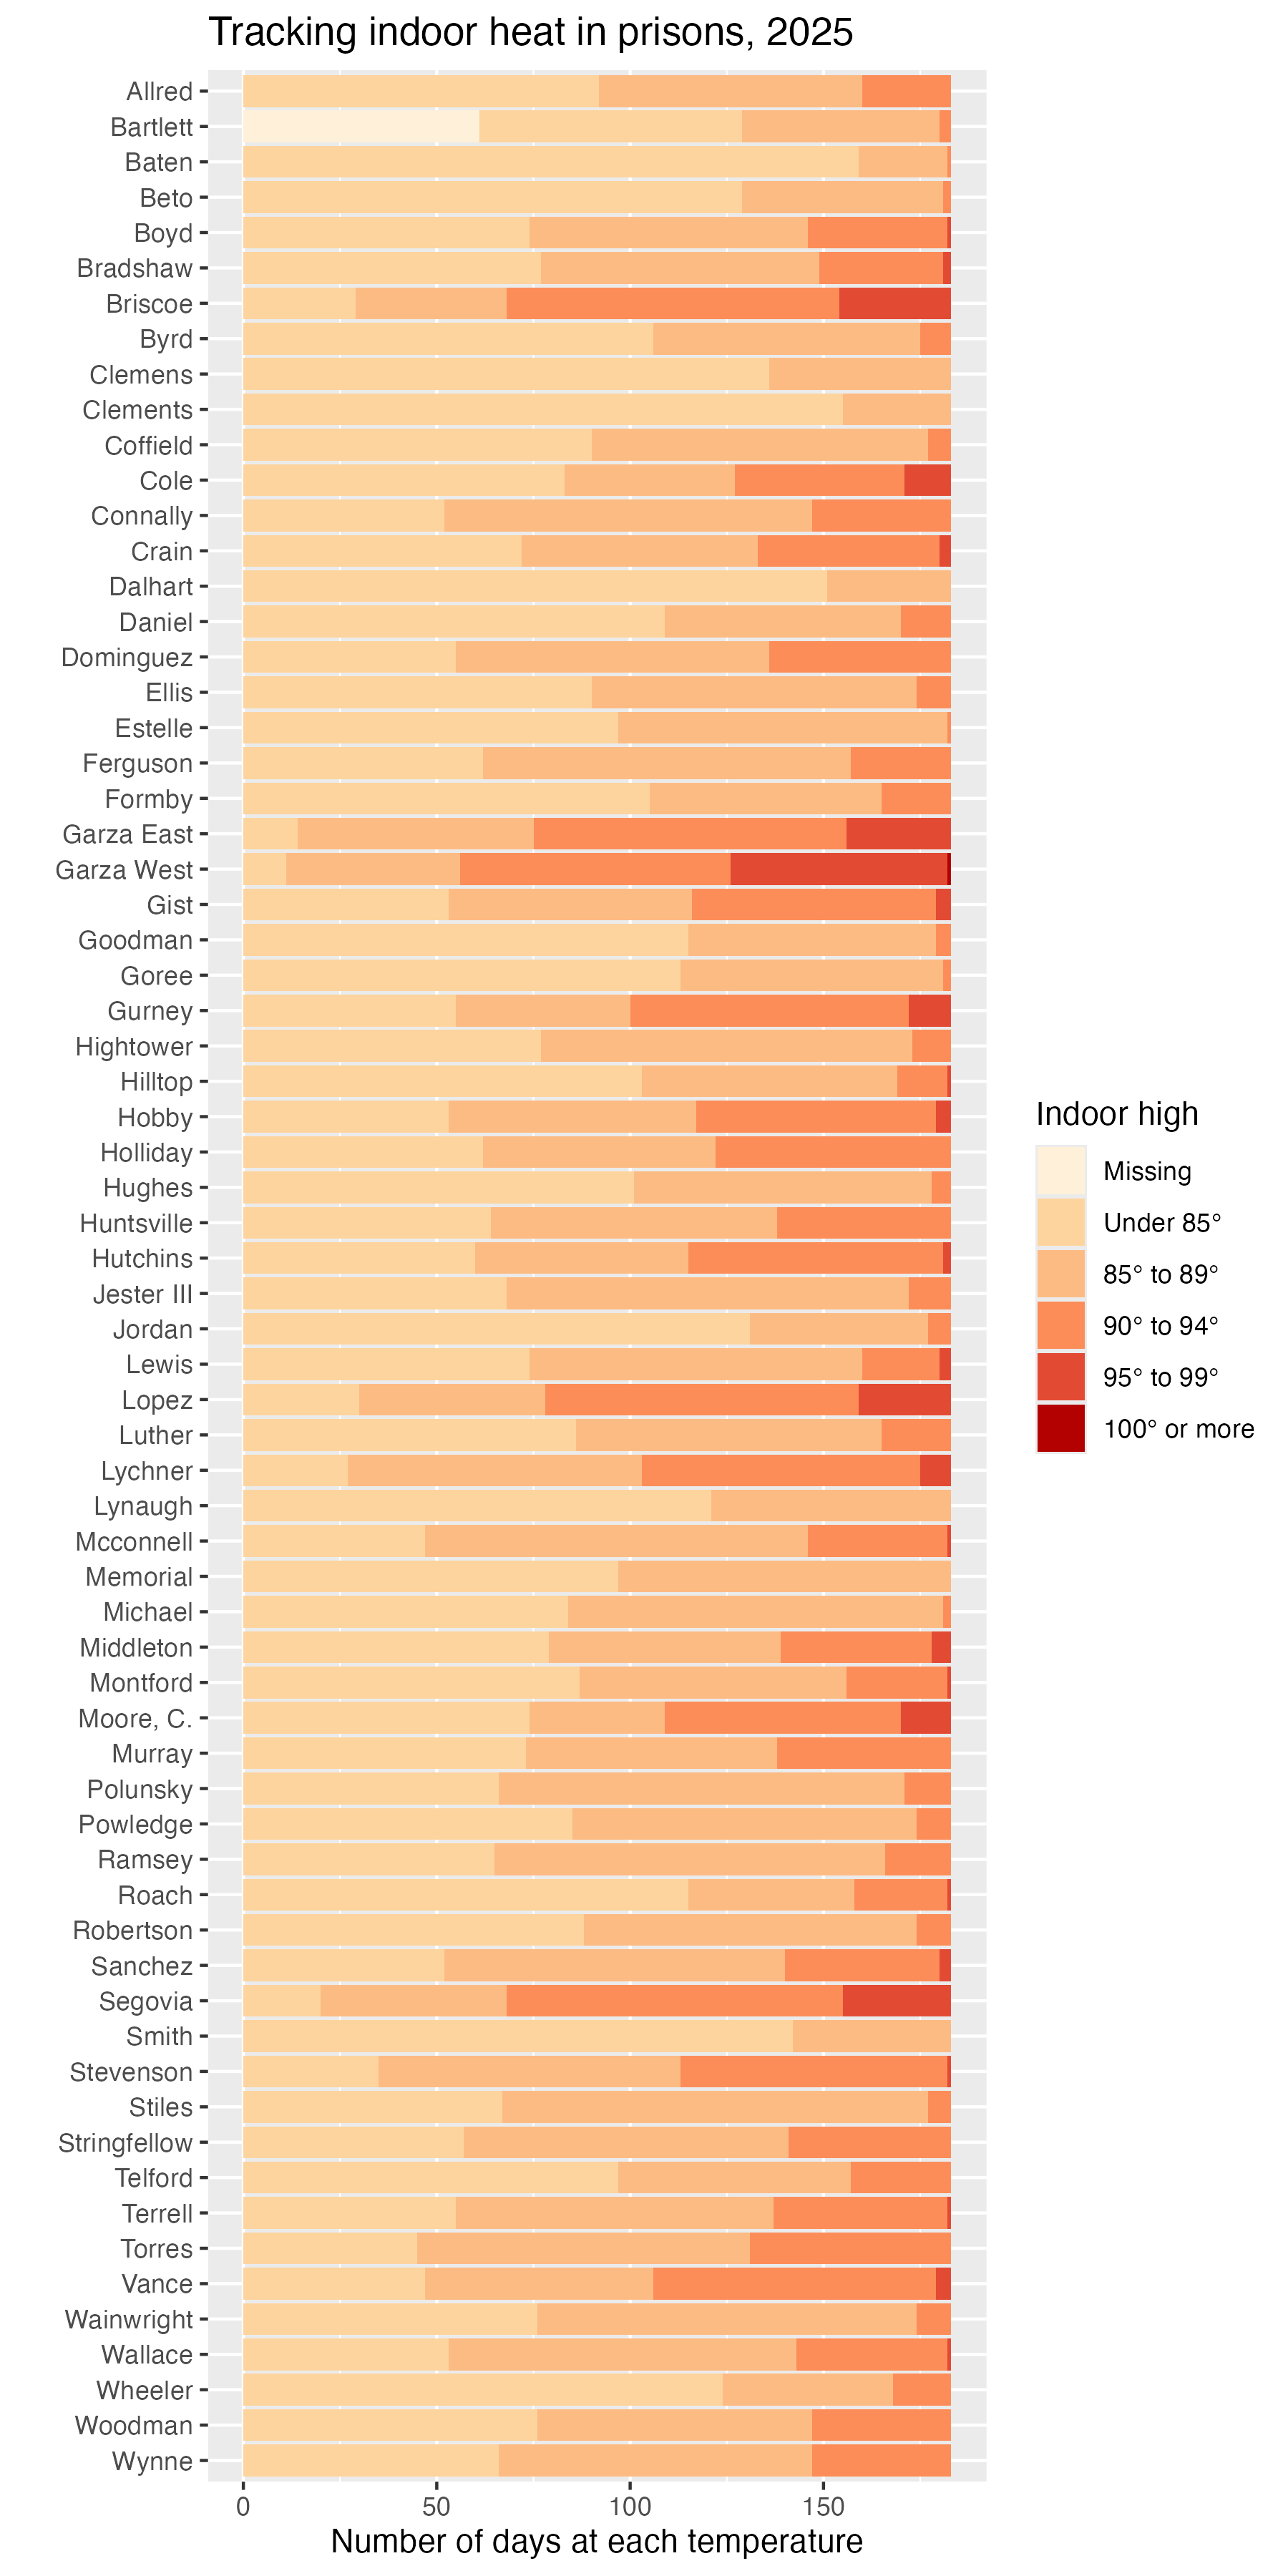
Temp ranges by month, year
This shows how many days per month a unit reached a specific indoor temperature.
Number of days unit reached a certain temperature within a year (which is really a 6-month period). Also the percentage of recorded days it was reached.
Across all prisons in the data in from 2022-2025, it reached 85 degrees indoors at least half the time between April 1 and Sept. 30.
It reached 90 degrees at least a quarter of the time in 2022, 2023 and 2024. In 2025, it was nearly 20% of the time.
It reached 100 degrees inside prisons more than 100 times in 2023 alone. Across all prisons, 37% of days between April and September reached 90 degrees in 2023.
85 degree threshold
Count units reaching 85 at least once
Starting with the 85 threshold data above, we find total units, then subtract a count units that didn’t reach 85.
Let’s find that unit in 2022 that didn’t reach 85 degrees. These are the lowest of the “highest temperature for each unit” where we can see Sayle didn’t reach 85 degrees twice. We only have 2022 data for the Sayle unit.
Click to show code
indoor_logs |>filter(year ==2022) |>group_by(unit) |>slice_max(temperature) |># find highest temp each unitarrange(temperature) |># find lowest of thoseselect(unit, date, temperature) |>filter(temperature <=90) # cutting here to show the next units for comparison
Takeaway: Every unit hit 85 degrees at least once every year with one exception in 2022, where the Sayle unit recorded 84.6 degrees as its highest temperature on two separate days. The Sayle unit is located a little over 100 miles west of Forth Worth and was not included in the data for 2023, 2024 or 2025.
Units reaching 85 half the time
This counts the number of units that reached 85 degrees for half of the days measured. We also calculate for 75% of the days measured.
In 2022, 53 of 68 units reached 85 degrees or above on at least half of the days measured. In 2023, it was 54 of 68, in 2024, it was 48 of 68, and in 2025, it was 47 out of 68.
Twelve units reached 85 degrees on 75% of days measured in 2022. In 2023, it was 10 units, and in 2024 and 2025, it was eight units.
Units most at 85
This shows units each year with the most days to reach 85.
Click to show code
at85_unit_year <- count_temps_unit_year |>group_by(year) |>slice_max(pct_85, n =3) |># n argument adjust number per yearselect(unit, year, total_days, cnt_85, pct_85)at85_unit_year
Garza West at 85
We’re taking the results above and focusing on Garza West for clarity.
Click to show code
at85_unit_year |>filter(unit =="Garza West")
Data takeaway:
Garza West reached 85 degrees on at least 80% of days between April and September each year since 2022. In 2025, only 11 days between April 1 and Sept. 30 did not reach at least 85 degrees indoors. In other words, 94% of days reached 85 degrees or higher. In 2022, it was 92% of days. Every year, Garza West was among the top three units with the highest percentage of days that reached 85 degrees or higher indoors. Garza West is a male prison located in Beeville, Texas, about 100 miles southeast of San Antonio. At full capacity, it houses 2,278 prisoners.
The Garza East and Segovia units reached 85 or above indoors for 92% and 89% of days between April and September in 2025, respectively.
In the Segovia unit in 2023, 94% of recorded days between June and September, or 115 days, reached 85 degrees. No data was recorded for April and May. The Segovia unit is located in South Texas outside of Edinburgh, about 20 miles north of McAllen.
Minimum days 85 threshold met
Here we find the fewest number of days it reached the 85-degree threshold within each year. We remove the Sayle unit that didn’t ever reach 85 in 2022.
Click to show code
count_temps_unit_year |>filter(cnt_85 >0) |># removes Sayle in 2022group_by(year) |>slice_min(cnt_85, n =1) |>select(unit, year, total_days, cnt_85, pct_85)
Data takeaways:
With the exception of the Sayle unit, it reached 85 degrees inside every unit for at least 43 days between April 1 and Sept. 30 in 2022.
In 2023, every unit saw at least 40 days reaching 85 degrees.
Even in the relatively cool 2024 and 2025 summers, it reached 85 degrees inside every unit for at least 27 and 24 days, respectively.
In 2023, 19 of 68 units reached 90 degrees at least half of the days measured. This was also true for nine units in 2022 and six units in 2024.
Across all years of data, two units reached 90 degrees for at least 75% of days measured, Segovia in 2023 and Garza West in 2024. -Segovia has fewer days measured in 2023, but it still reached 90 degrees more than 100 times. In 2024, Garza West reached 90 degrees 137 times, or 75% of days between April 1 and Sept. 30.
Units with most days at 90
This shows units with the most days to reach 95 within each year.
Click to show code
units_at_90 <- count_temps_unit_year |>group_by(year) |>slice_max(pct_90, n =3) |># n argument adjust number per yearselect(unit, year, total_days, cnt_90, pct_90)units_at_90
Click to show code
units_at_90 |>filter(unit =="Garza West")
Data takeaway: In the Garza West unit, the temperature reached at least 90 degrees indoors on at least 65% of days recorded each year from 2022 to 2025. In 2023 and 2024, 73% and 75% of days reached 90 degrees, respectively.
Takeaway: In each year from 2022 to 2024, at least 50 of 68 units reached 95 degrees inside at least once between April 1 and Sept. 30. In 2025, 26 units reached 95 degrees at least once.
Units that reach 95 quarter of time
Here we calculate the number of units that reach 95 degrees at least a quarter of recorded days each year. This is a lower percentage than other thresholds.
Data takeaway: In 2023, there were 13 units where it reached 95 degrees inside a quarter of the time, or one in every four days between April and September. This was true for six units in 2022, three units in 2024, and one in 2025.
Units most at 95
This shows units with the most days to reach 95 within each year.
Click to show code
units_at_95 <- count_temps_unit_year |>group_by(year) |>slice_max(pct_95, n =1) |># n argument adjust number per yearselect(unit, year, total_days, cnt_95, pct_95)units_at_95
Data takeaway: At the Garza West unit in 2023, it reached 95 degrees indoors more than 100 times, or individual days. In other words, nearly three out of every five days between April 1 and Sept. 30. reached 95 degrees indoors.
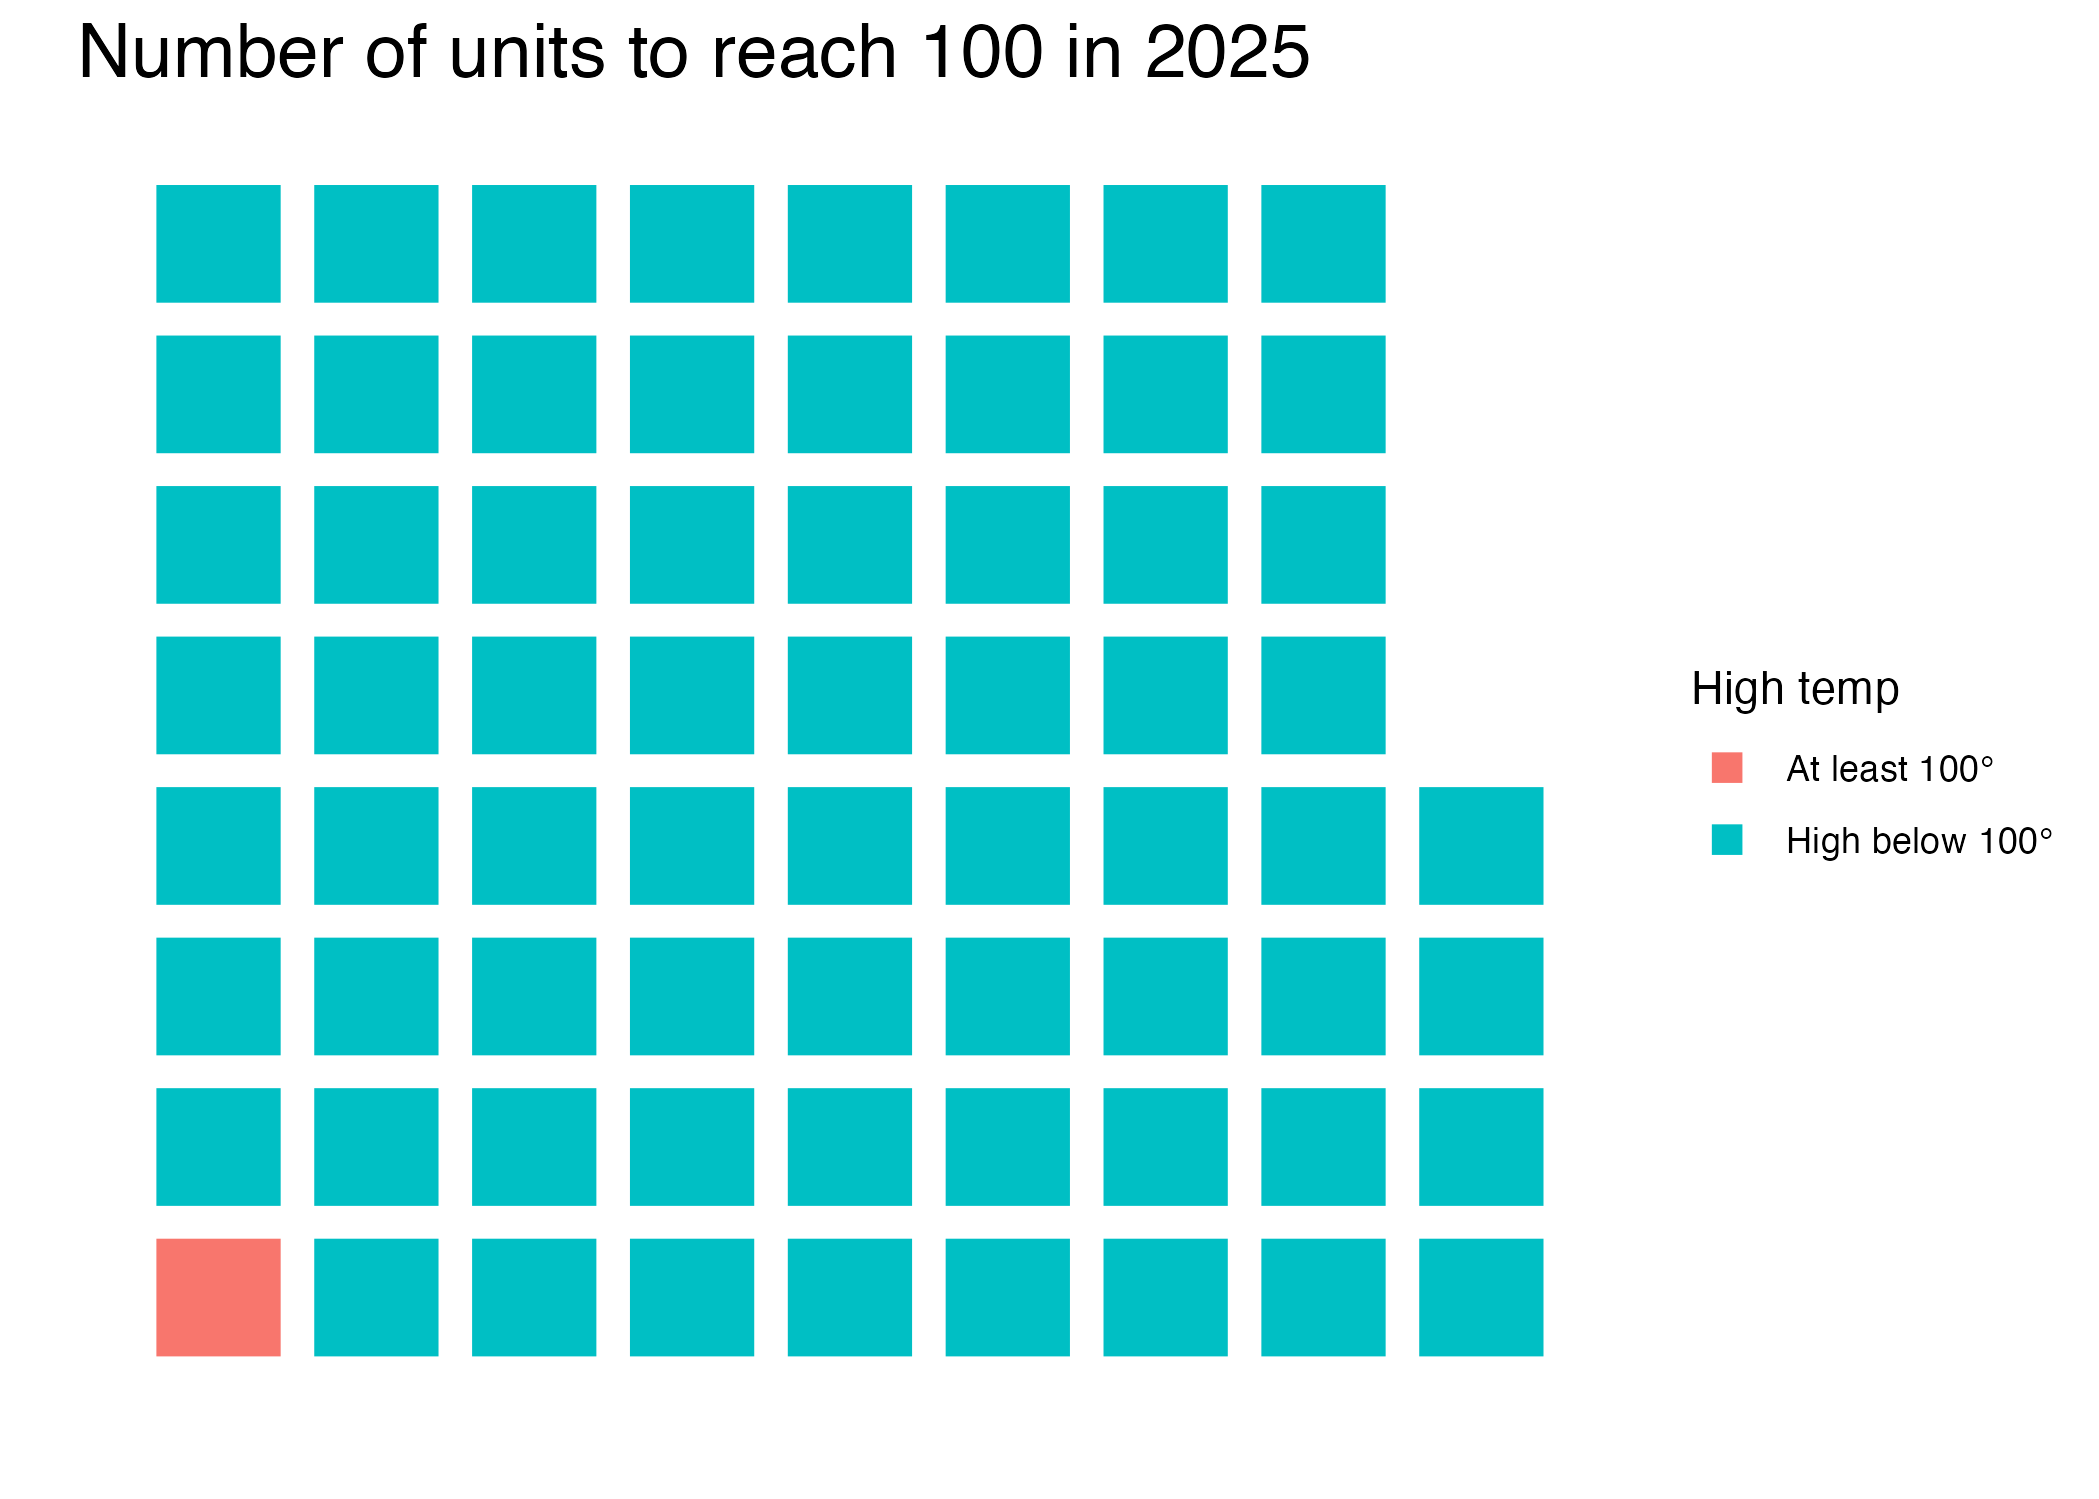
indoor_logs |>filter(unit =="Garza West", temperature ==100)
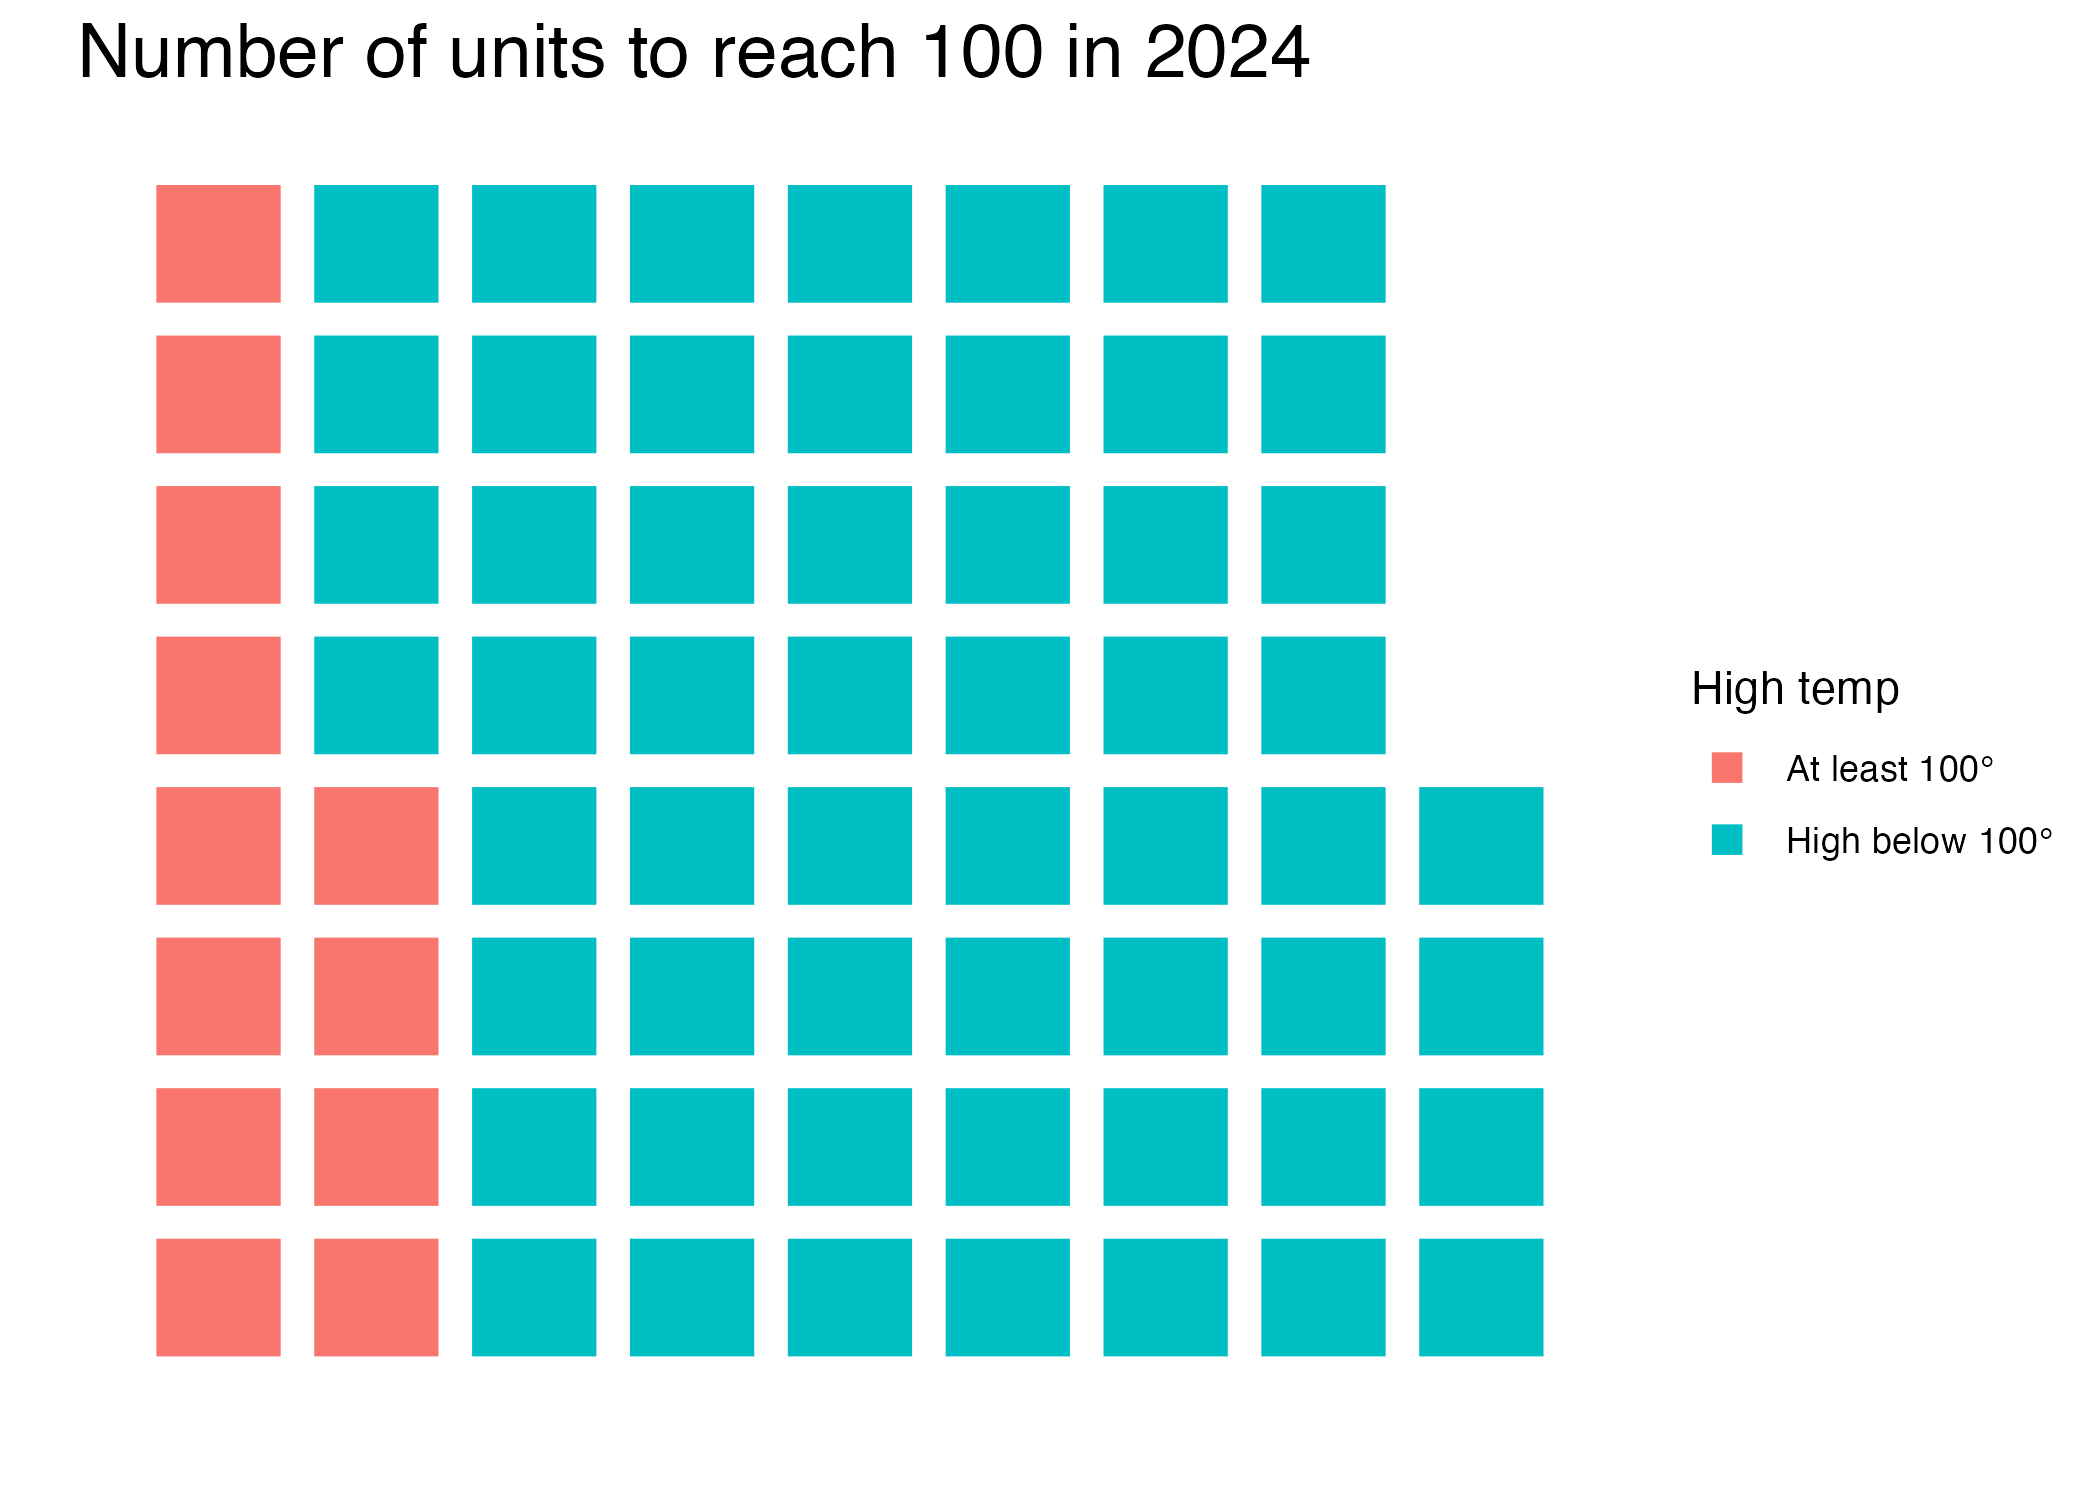
Data takeaways: Between 2022 and 2024, at least a dozen units each year reached 100 degrees inside at least once. In 2023, 18 units reached 100 degrees indoors at least once between April and September. In 2025, only one unit reached 100 degrees - Garza West on August 29.
Plot units at 100
This attempts to show how many units reached 100 degrees at least once in a given year.
Since we’ll want to make this chart for several years, I’ll make it into a function to reuse.
Click to show code
prison_waffle <-function(.data, yr) { .data |>select(unit, year, cnt_100) |>mutate(r_100 =if_else(cnt_100 >0, "At least 100°", "High below 100°")) |>filter(year == yr) |>waffle_iron(aes_d(group = r_100)) |>ggplot(aes(x, y, fill = group)) +geom_waffle() +theme_waffle() +labs(title =paste("Number of units to reach 100 in", yr),x ="", y ="", fill ="High temp" )ggsave(paste0("figures/waffle_plot_", yr, ".png"))}count_temps_unit_year |>prison_waffle(2022)count_temps_unit_year |>prison_waffle(2023)count_temps_unit_year |>prison_waffle(2024)count_temps_unit_year |>prison_waffle(2025)
Takeaway: Garza West reached 100 degrees inside on 46 days between April 1 and Sept. 30 in 2023. In other words, 25%, or one in four days, reached 100 degrees.
Plot thresholds by year
Here we’ll attempt to plot how many days a unit reached a certain temperature within a given year. We need to recalculate our thresholds.
Here we bin the number of days at certain temperatures, which is different than we we’ve been doing previously (which was total days at/above a temp). We also have to account for missing data, so we create cnt_na to add any missing days to the data.
To plot this we have to reshape the data, then plot as a bar chart. We save the chart before displaying it so we can control the size since there are so many units to show.
The plotting has been turned into a function to keep it dRy.
First we pivot the data and turn the thresholds into a factor.
# plot the data into an object and then save that object into the figures folder.plot_thresh_data <-function(yr) { thresh_plot <- thresh_data |>filter(year == yr) |>ggplot(aes(x = days, y =fct_rev(unit), fill = threshold)) +geom_bar(stat ="identity", position =position_stack(reverse =TRUE)) +scale_fill_brewer(palette='OrRd',labels =c(cnt_na ="Missing",cnt_n85 ="Under 85°",cnt_85 ="85° to 89°",cnt_90 ="90° to 94°",cnt_95 ="95° to 99°",cnt_100 ="100° or more" )) +# theme(legend.position = "bottom") +labs(title =paste("Tracking indoor heat in prisons,", yr),x ="Number of days at each temperature", y ="",fill ="Indoor high" )ggsave(paste0("figures/thresh_plot_", yr, ".png"), width =6, height =12)}plot_thresh_data(2022)plot_thresh_data(2023)plot_thresh_data(2024)plot_thresh_data(2025)
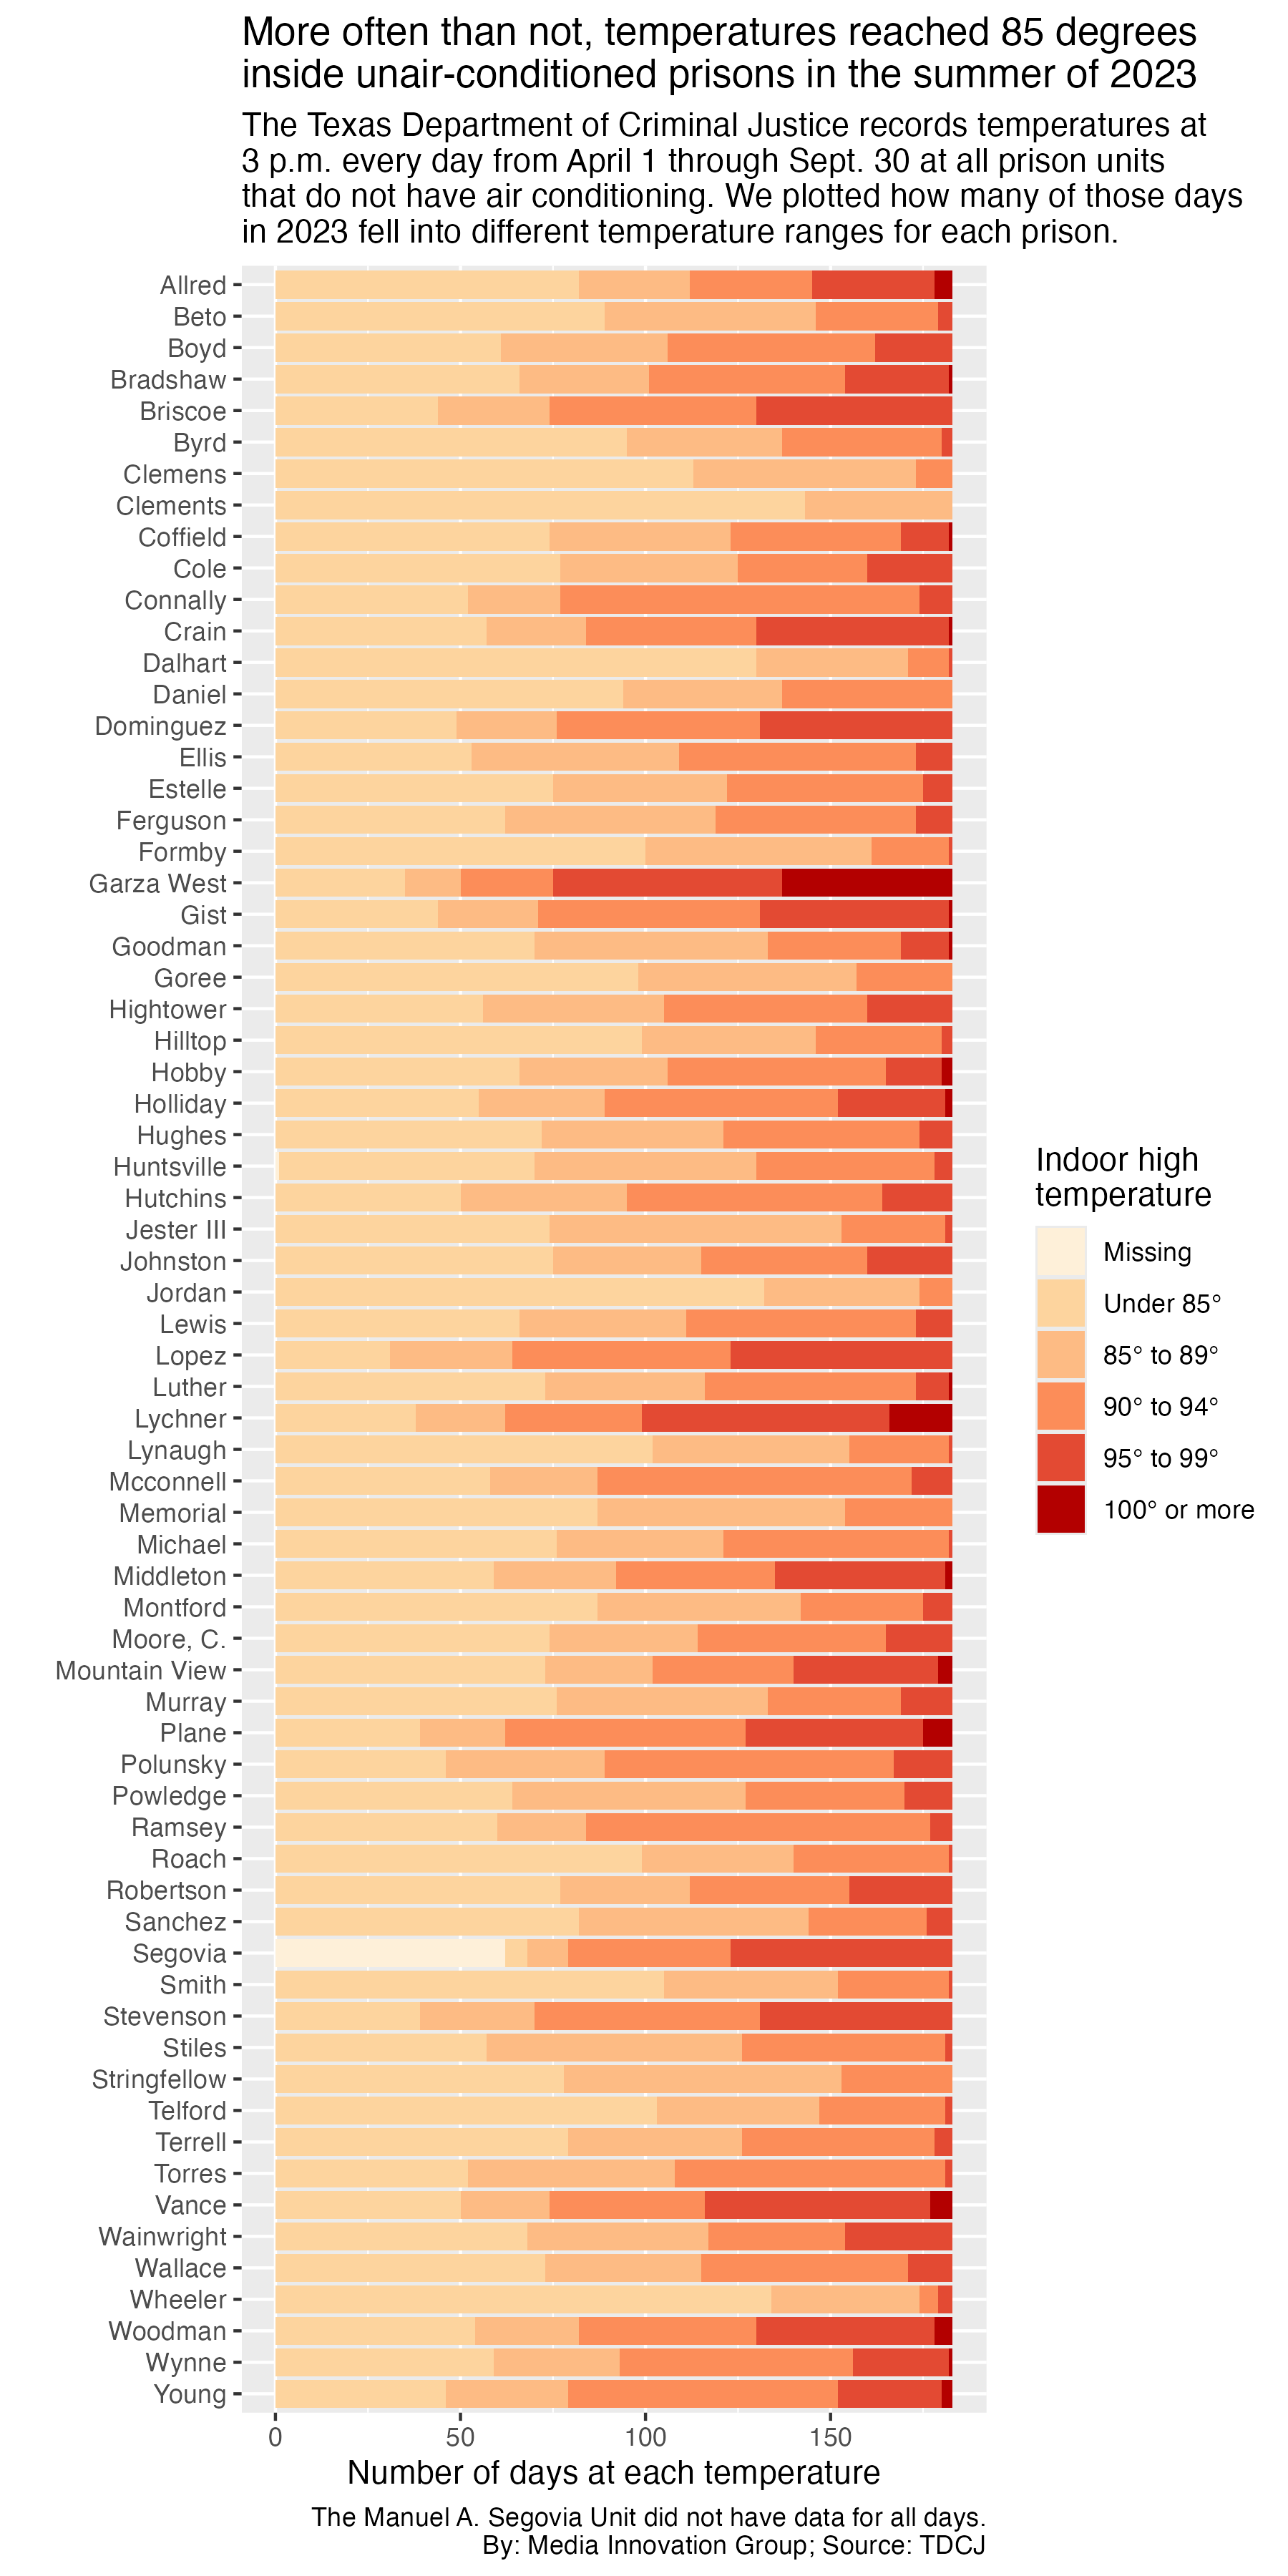
We are using the 2023 version of this threshold chart for a story on KUT.org, so we’ll work out the language, etc.
Draft the chart
Click to show code
thresh_pot_2023_print <- thresh_data |>filter(year ==2023) |>ggplot(aes(x = days, y =fct_rev(unit), fill = threshold)) +geom_bar(stat ="identity", position =position_stack(reverse =TRUE)) +scale_fill_brewer(palette='OrRd',labels =c(cnt_na ="Missing",cnt_n85 ="Under 85°",cnt_85 ="85° to 89°",cnt_90 ="90° to 94°",cnt_95 ="95° to 99°",cnt_100 ="100° or more" )) +# theme(legend.position = "bottom") +labs(title =str_wrap("More often than not, temperatures reached 85 degrees inside unair-conditioned prisons in the summer of 2023", width =55),subtitle =str_wrap("The Texas Department of Criminal Justice records temperatures at 3 p.m. every day from April 1 through Sept. 30 at all prison units that do not have air conditioning. We took the 2023 temperature readings and counted how many days each prison measured within different temperature ranges. Each bar below is a prison unit, and each segment is how many days measured within each temperature range.", width =68),x ="Number of days in each temperature range", y ="Prison units without air conditioning",fill ="Indoor hightemperature",caption ="The Manuel A. Segovia Unit did not have data for all days.By: Media Innovation Group; Source: TDCJ" )ggsave("figures/thresh_pot_2023_print.png", width =6, height =12)
2023 chart for print
Format for Datawrapper
Here we reformat this data to build this chart in datawrapper.
Click to show code
thresh_2023_dw <- thresh_data |>filter(year ==2023) |># remove for all yearspivot_wider(names_from = threshold, values_from = days) |>mutate(cnt_na =183- (cnt_n85 + cnt_85 + cnt_90 + cnt_95 + cnt_100) ) |>select(Unit = unit,# Year = year,`Missing`= cnt_na,`Under 85°`= cnt_n85,`85° to 89°`= cnt_85,`90° to 94°`= cnt_90,`95° to 99°`= cnt_95,`100° or more`= cnt_100 )thresh_2023_dw
Determining the indoor temperatures on the days and unit where prisoners died.
Hagerty at Murray unit, 2023
Click to show code
indoor_logs |>select(unit, date, temperature) |>filter(unit =="Murray", date =="2023-06-30")
Data takeaway: On June 30, 2023, Elizabeth Hagerty died in her cell at the Murray unit, located in Gatesville, Texas, about 100 miles north of Austin. According to the autopsy report, she died at 12:48 a.m. The temperature in her cell was 95.7 degrees. The recorded indoor temperature for the Murray unit that day, reportedly taken at 3 p.m., was 90 degrees. Hagerty was 37 years old.
TDCJ hand-recorded outdoor temperature log for 12:30 a.m. on June 30, 2023 at the Murray unit: 83 degrees with a heat index of 87.
NWS log for Gatesville (station ID KGOP) at 12:15 a.m.: 82 degrees with a heat index of 85.6.
Castillo at Hughes unit, 2023
Click to show code
indoor_logs |>select(unit, date, temperature) |>filter(unit =="Hughes", date =="2023-08-05")
Data takeaway: On Aug. 5, 2023, John Castillo died indoors at the Hughes unit, located in Gatesville, Texas, about 100 miles north of Austin. According to the autopsy report, he died at 11:33 p.m. His core body temperature was 107.5 degrees. The recorded indoor temperature for the Hughes unit that day, reportedly taken at 3 p.m., was 94.4 degrees. Castillo was 32 years old.
TDCJ hand-recorded outdoor temperature log for 11:30 p.m. on Aug. 5, 2023 at the Hughes unit: 88 degrees with a heat index of 89.
NWS log for Gatesville (station ID KGOP) at 11:15 p.m.: 86 degrees with a heat index of 86.8.
Womack at Coffield, 2023
Click to show code
indoor_logs |>select(unit, date, temperature) |>filter(unit =="Coffield", date =="2023-08-21")
Data takeaway: On Aug. 21, 2023, Patrick Womack died in his cell at the Coffield unit, located in Tennessee Colony, Texas, about 100 miles northwest of Waco. According to the autopsy report, he died at 1:53 p.m. His core body temperature was 106.9 degrees. The recorded indoor temperature for the Coffield unit that day, reportedly taken at 3 p.m., was 96.6 degrees. Womack was 50 years old.
TDCJ hand-recorded outdoor temperature log for 1:30 p.m. on Aug. 21, 2023 at the Coffield unit: 104 degrees with a heat index of 113.
NWS log for Palestine (station ID KPSN) at 2:15 p.m.: 104 degrees with a heat index of 105.3. Note: the Palestine Municipal Airport station is located 15 miles away from the Coffield unit.
Cortez at Goree unit, 2024
Click to show code
indoor_logs |>select(unit, date, temperature) |>filter(unit =="Goree", date =="2024-06-07")
Data takeaway: On June 7, 2024, Oscar R. Cortez died outdoors at the Goree unit, located in Hunstville, Texas, about 65 north of Houston. According to the Death in Custody report, he died at 5:20 p.m. The recorded indoor temperature for the Goree unit that day, reportedly taken at 3 p.m., was 86.6 degrees. Cortez was 44 years old.
NWS log for Hunstville (station ID KUTS) at 4:53 p.m.: 91 degrees with a heat index of 93.