library(tidyverse)Solutions Day 2
I NEED TO GO OVER THIS ONE MORE TIME VS THE LESSON TO MAKE SURE THEY MATCH.
Goals
To learn about: arrange, filter, slice, group_by, summarize
To find several values from our data:
- The coldest and warmest days
- The rainiest and snowiest days
- Years with most snow days
- Years with most 100+ days
- Years with most rain
- Earliest day to reach 100+ each year
With this lesson we’ll just use Texas data. (You theoretically could use a different state, but would need to adjust your code to import the right data, use valid cities, etc.)
Setup
Import
Import your cleaned data using read_rds() and save it into an object:
tx_clean <- read_rds("data-processed/tx_clean.rds")Arrange
Find the coldest day, warmest day, most snow, most rain.
Coldest day
tx_clean |>
  arrange(tmin) |>
  select(city, date, tmin)
Hotest day
tx_clean |>
  arrange(desc(tmax)) |>
  select(city, date, tmax)
OYO: Most rain
Find the days with the most rain.
tx_clean |>
  arrange(desc(rain)) |>
  select(city, date, rain)
OYO: Most snow
Find the days with the most snow.
tx_clean |>
  arrange(desc(snow)) |>
  select(city, date, snow)
Filter
Find days that are 100+.
tx_clean |>
  filter(tmax >= 100) |>
  select(city, date, tmax)
Filter for days in Dallas that are 100+
tx_clean |>
  filter(tmax >= 100, city == "Dallas") |>
  select(city, date, tmax)
Find days where it snowed, or there is snow still on the ground.
tx_clean |>
  filter(snow > 0 | snwd > 0) |>
  select(city, date, snow, snwd)
OYO: Snow days in Dallas
Find days where it snowed or there is snow on the ground, but only in Dallas.
tx_clean |>
  filter(snow > 0 | snwd > 0, city == "Dallas") |>
  select(city, date, snow, snwd)
Slice
Use slice_min to find the coldest day in our data.
tx_clean |>
  slice_min(tmin) |>
  select(city, date, tmin)
Group and slice
Add group_by to find the coldest day in each city.
tx_clean |>
  group_by(city) |>
  slice_min(tmin) |>
  select(city, date, tmin)
OYO: Hottest day in each city
Use group_by and slice_max to find the hottest days in each city. Note there might be some ties.
tx_clean |>
  group_by(city) |>
  slice_max(tmax) |>
  select(city, date, tmax)
Multiple groups
Hottest day each year in each city
tx_clean |>
  group_by(yr, city) |>
  slice_max(tmax) |>
  select(city, tmax) |>
  distinct()
Adding missing grouping variables: `yr`Summarize
Summarize to find our first date, last date and number of rows.
tx_clean |>
  summarize(
    e_date = min(date),
    l_date = max(date),
    cnt = n()
  )
Group and summarize
Group the data by city and find the first date, last date and number of rows.
tx_clean |>
  group_by(city) |>
  summarise(
    e_date = min(date),
    l_date = max(date),
    cnt = n()
  )
Add city and yr as a group:
tx_clean |>
  group_by(city, yr) |>
  summarise(
    e_date = min(date),
    l_date = max(date),
    cnt = n()
  )
`summarise()` has grouped output by 'city'. You can override using the
`.groups` argument.Group and summarize: Count
Find the number of days in Austin that were 100+.
tx_clean |>
  filter(city == "Austin", tmax >= 100) |>
  group_by(yr) |>
  summarize(hot_days = n()) |>
  arrange(desc(hot_days))
Find the years with the most 100+ degree days in each city.
tx_clean |>
  filter(tmax >= 100) |>
  group_by(city, yr) |>
  summarize(hot_days = n()) |>
  arrange(desc(hot_days))
`summarise()` has grouped output by 'city'. You can override using the
`.groups` argument.OYO: Most snow days by city each year
Count only the days that where it snowed.
tx_clean |>
  filter(snow > 0) |>
  group_by(city, yr) |>
  summarise(snow_days = n()) |>
  arrange(desc(snow_days))
`summarise()` has grouped output by 'city'. You can override using the
`.groups` argument.Group and Summarize: Math
Years with most rain in each city.
tx_yr_rain <- tx_clean |>
  filter(yr > 1939, yr < 2023) |>
  group_by(city, yr) |>
  summarise(tot_rain = sum(rain, na.rm = TRUE)) |>
  arrange(city, desc(tot_rain))
`summarise()` has grouped output by 'city'. You can override using the
`.groups` argument.tx_yr_rainThe most rain in each city, sliced:
tx_yr_rain |>
  group_by(city) |>
  slice_max(tot_rain, n = 3)
The least rain in each city, sliced:
tx_yr_rain |>
  group_by(city) |>
  slice_min(tot_rain, n = 3)
OYO: Years with most snow
Find the years with the most total snow in each city
tx_yr_snow <- tx_clean |>
  group_by(city, yr) |>
  summarize(tot_snow = sum(snow)) |>
  arrange(city, desc(tot_snow))
`summarise()` has grouped output by 'city'. You can override using the
`.groups` argument.tx_yr_snowMost snow, sliced:
tx_yr_snow |>
  group_by(city) |>
  slice_max(tot_snow, n = 3)
Working through logic
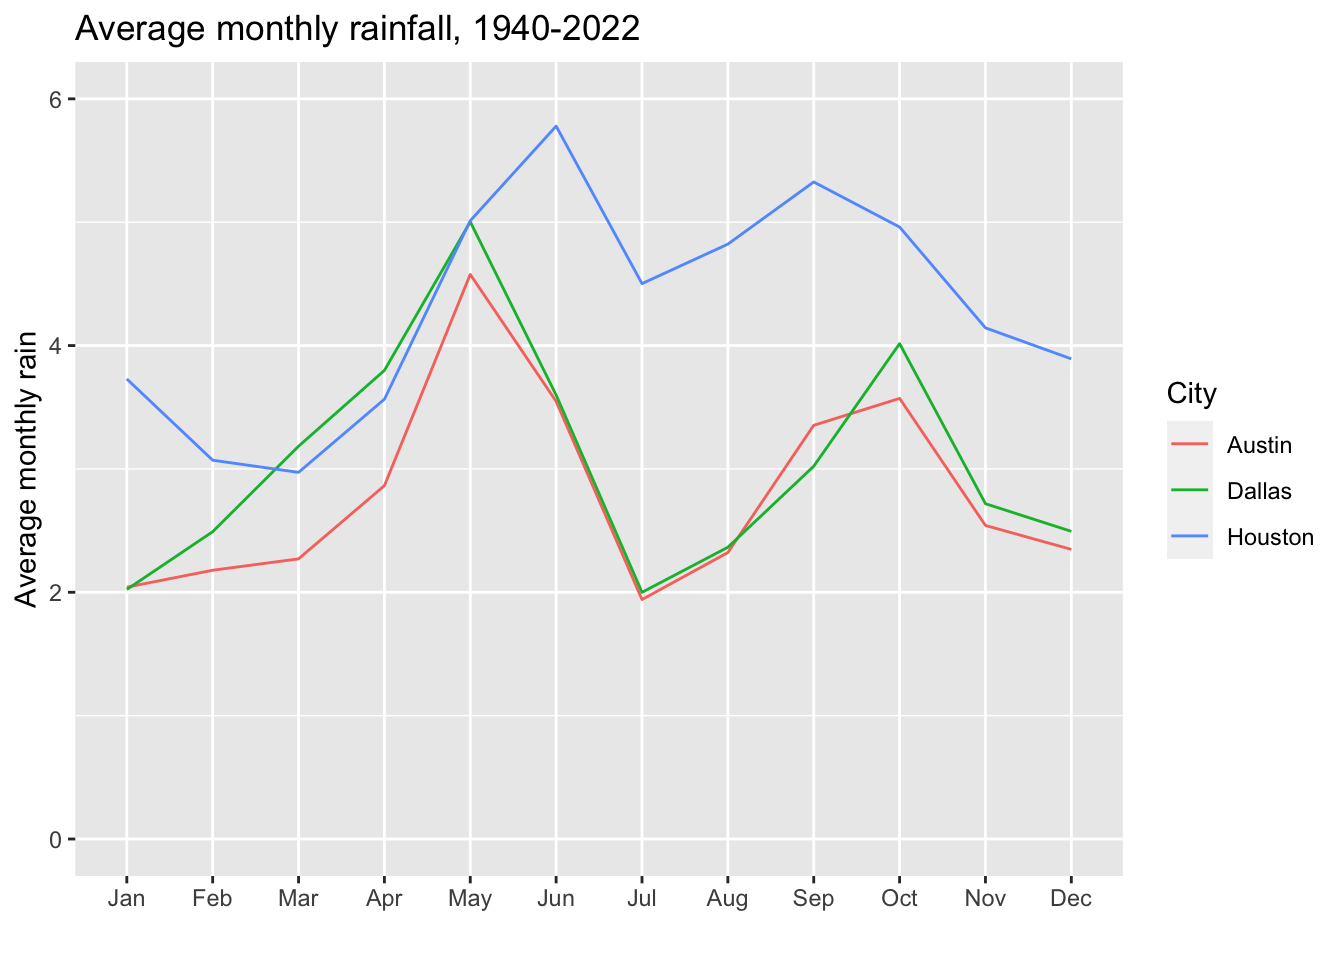
Getting average monthly rain for each city.
First get the total rain for each month/year:
tx_mn_yr_rain <- tx_clean |>
  filter(yr >= 1940, yr <= 2022) |>
  group_by(city, mn, yr) |>
  summarize(mn_yr_rain = sum(rain, na.rm = TRUE))
`summarise()` has grouped output by 'city', 'mn'. You can override using the
`.groups` argument.tx_mn_yr_rain Then calculate the average for the months in each city:
city_avg_rain <- tx_mn_yr_rain |>
  group_by(city, mn) |>
  summarise(avg_mn_rain = mean(mn_yr_rain))
`summarise()` has grouped output by 'city'. You can override using the
`.groups` argument.city_avg_rainAnd as a tease, we plot it:
city_avg_rain |>
  ggplot(aes(x = mn, y = avg_mn_rain, group = city)) +
  geom_line(aes(color = city)) +
  ylim(0,6) +
  labs(
    title = "Average monthly rainfall, 1940-2022",
    x = "", y = "Average monthly rain",
    color = "City"
  )
Challenge: Earliest 100+ day each city
For each city, find the earliest day of a year in which it reached 100 degrees.
tx_clean |>
  filter(tmax >= 100) |>
  group_by(city) |>
  slice_min(yd) |>
  select(city, date, tmax)