library(tidyverse)
library(janitor)14 Counting shortcuts
We count stuff in data science (and journalism) all the time. In our Billboard project we used summarize() with n() to count rows because we needed to understand the concepts of group_by, summarize and arrange. It is perfectly valid and the best way to explain and understand grouping and summarizing.
But in the interest of full disclosure, know there are some neat shortcuts to count rows of data.
14.1 Count
The count() function takes arguments of the columns you want to group and then does the summarize(cnt = n()) for you as a default. We’ll demonstrate this using the Billboard data.
14.1.1 Setup and import
We are going to pull in both tidyverse and janitor as we’ll end up using both in this chapter. I usually include both in every notebook.
And import some data …
hot100 <- read_rds("data-processed/01-hot100.rds")14.1.2 Basic count
We’re going to rework our first quest of the Billboard analysis:
Which performer had the most appearances on the Hot 100 chart at any position?
Our logic is we want to count the number of rows based on each performer. We do this by adding the variables we want to group as arguments to count():
hot100 |>
  count(performer)
14.1.3 Sort the results
If we want the value with the most rows at the top (and we almost always do) then we can add an argument: sort = TRUE.
hot100 |>
  count(performer, sort = TRUE)
14.1.4 Name the new column
Notice the counted table is called n. We can rename that with another argument, name = and give it the name we want in quotes.
hot100 |>
  count(performer, sort = TRUE, name = "appearances")
14.1.5 Filter results as normal
To cut off the results, we just filter as we normally would.
hot100 |>
  count(performer, sort = TRUE, name = "appearances") |>
  filter(appearances > 650)
So the code above does the same things here as we did in our first Billboard quest, but with fewer lines.
14.1.6 Counting multiple variables
We can group on multiple variables by adding them as arguments. We’ll show this with the second quest:
Which song (title & performer) has been on the charts the most?
hot100 |>
  count(
    title,
    performer,
    sort = TRUE,
    name = "appearances") |>
  filter(appearances >= 70)
Same answer. We are just grouping by both title and performer, then summarizing to “count” how many matching rows there are.
14.2 Tabyl
Another useful function for counting rows based on groups is tabyl() which can also give us percentages of those counts.
The tabyl() function is from the janitor package, which is another reason I almost always include it in my notebooks.
14.2.1 Import some data
We need some data to work on here. These are wells drilled in Hays, Travis and Williamson counties, which I then filter to recent records between 2020 and 2023. I also add a yr value based on the drilling date.
wells <-
  read_rds("data-processed/wells.rds") |>
  filter(drilling_end_date >= "2020-01-01", drilling_end_date < "2024-01-01", ) |>
  mutate(yr = year(drilling_end_date))

wells |> glimpse()
Rows: 3,501
Columns: 18
$ well_report <dbl> 656661, 658086, 656880, 656699, 658285, 659276, 65…
$ type_of_work <chr> "New Well", "New Well", "New Well", "New Well", "N…
$ proposed_use <chr> "Domestic", "Domestic", "Domestic", "Domestic", "D…
$ proposed_use_clean <chr> "Domestic", "Domestic", "Domestic", "Domestic", "D…
$ owner_name <chr> "Troy Smith", "Jeffrey K. Van Delden", "Jerry Jord…
$ county <chr> "Hays", "Travis", "Williamson", "Travis", "William…
$ well_address <chr> "1601 Pump Station RD, Wimberley, 78676", "5129 Bu…
$ coord_dd_lat <dbl> 30.07611, 30.32306, 30.58035, 30.44222, 30.47167, …
$ coord_dd_long <dbl> -98.19639, -97.79639, -97.74951, -98.07833, -97.19…
$ grid_number <chr> "57-63-5", "58-42-5", "58-27-4", "57-40-5", "58-39…
$ drilling_start_date <date> 2023-12-29, 2023-12-28, 2023-12-27, 2023-12-27, 2…
$ drilling_end_date <date> 2023-12-29, 2023-12-28, 2023-12-28, 2023-12-27, 2…
$ borehole_depth <dbl> 710, 610, 890, 190, 353, 400, 615, 650, 790, 470, …
$ driller_signed <chr> "Martin Dale Lingle Jr", "Martin Dale Lingle Jr", …
$ driller_company <chr> "Centex Pump & Supply, Inc.", "Centex Pump & Suppl…
$ license_number <dbl> 54813, 54813, 4064, 54813, 1750, 60765, 60683, 606…
$ plugging_report <dbl> NA, NA, NA, NA, NA, NA, NA, NA, NA, NA, NA, NA, NA…
$ yr <dbl> 2023, 2023, 2023, 2023, 2023, 2023, 2023, 2023, 20…We haven’t really used this data before so let’s look at a few rows just to talk it through.
wells |> head()Each row here is a well drilled into the ground. The variables include details like where, who, when, etc. A couple of variables we’ll pay attention to …
proposed_use_cleanis the reason for the well, cleaned up a little to combine some categories.drilling_end_dateis when the well was completed.
We’ll use the proposed_use_clean column to see what kinds of wells have been drilled.
Let’s start by using count() function we learned about above.
wells |> count(proposed_use_clean)We’re counting the number of rows that have each proposed use. We can see there are more “Domestic” wells than any other category.
14.2.2 The beauty of tabyl
tabyl() works like count, but it also adds the percentage share by default. While the resulting table looks physically different in your notebook compared to our tidyverse outputs, it is still a data frame that works in similar ways, as it can be piped, etc. They look the same when rendered.
wells |> tabyl(proposed_use_clean)What we get here in addition to the n column that counts the rows, is a raw percent column that tells us the share for each use category. This is the basic “part / whole” part of a percentage.
With this we can see that about 44% of the wells are “Domestic” wells.
There are a number of additional “adorn” functions that can help format our result.
Here we convert the raw percent to an actual percentage (to include the * 100 part):
wells |>
  tabyl(proposed_use_clean) |>
  adorn_pct_formatting()
And if we don’t want that percent sign, we can remove it with the affix_sign = F argument.
wells |>
  tabyl(proposed_use_clean) |>
  adorn_pct_formatting(affix_sign = F)
Do note the percent column is still a text <chr> data type and would have to be converted to a number to do math or sorting properly.
14.2.3 Two-way tabyls
Like with count(), you can group by more than one value with tabyl(). We’ll do this to get the proposed use type by year.
Two-way tables don’t automatically add percentages. These are the “count” of rows where the proposed_use_clean and yr values are the same.
wells |>
  tabyl(proposed_use_clean, yr)
14.2.4 Add totals rows
Another very useful adornment in tabyl is to add totals to the rows or columns. This will total any numerical value in your data frame.
By default it adds totals for each “row” so you get a total at the bottom.
wells |>
  tabyl(proposed_use_clean, yr) |>
  adorn_totals()
But you could also add totals by “col”:
wells |>
  tabyl(proposed_use_clean, yr) |>
  adorn_totals("col")
or both:
wells |>
  tabyl(proposed_use_clean, yr) |>
  adorn_totals("both")
You don’t have to build your data frame with tabyl to use the adorn_totals() function, as it can be added to any data frame. Here I’ve taken the first few rows and columns of the starwars data set and added adorn_totals(). See that it adds the totals of the included rows when they are numbers, and uses - when they are not numbers.
starwars |>
  select(name:skin_color) |>
  head() |>
  adorn_totals()
14.2.5 Percentages in two-way tabyls
OK, this gets a little confusing, but we can also get percentages for two-way tabyls.
Note that by default these are the percentages within each ROW, so of all the “Closed-Loop Geothermal” wells drilled between 2020 and 2023, 39.3% of them were in the year 2023. In other words, the percentages total 100 going horizontally across a row.
wells |>
  tabyl(proposed_use_clean, yr) |>
  adorn_percentages()
What we really want is the percentage of wells were Closed-Loop Geothermal vs Domestic WITHIN a year. We want the percentage to total 100 for each column.
We’ll also add the percentage formatting to make it easier to read.
wells |>
  tabyl(proposed_use_clean, yr) |>
  adorn_percentages("col") |> # where we switched to column percentages
  adorn_pct_formatting()
Now we can see that the share of wells drilled for “Domestic” use have generally grown year over year.
14.2.6 Both counts, percentages
If you really want counts along with your percentages, you can add the numbers back with adorn_ns().
wells |>
  tabyl(proposed_use_clean, yr) |>
  adorn_percentages("col") |>
  adorn_pct_formatting() |>
  adorn_ns()
14.2.7 Putting this together
So here is a use case: I want to “see” how the percentage of water wells drilled by type (like domestic vs irrigation) and how that percentage has changed year over year. Using tabyl() I can easily get the percentages within each year and then plot them.
I’ll string this together and the annotate it.
First, we get our basic table of percentages like we did above.
- 1
- Build our tabyl using two variables
- 2
- Switch our values to percentages based on the column
- 3
- Convert to a friendly “* 100” percentage
Now we reconfigure the data to “long” format for ggplot.
- 1
- Here we pivot_longer to make a data frame more friendly for ggplot
- 2
- Because our “percentages” are text, we need to convert them to a number
Now that we have ggplotable data, we can make a stacked percentage column chart.
wells_by_yr_type_plot <- wells_by_yr_type_long |>
  ggplot(aes(x = yr, y = percentage)) +
  geom_col(aes(fill = proposed_use_clean)) +
  labs(
    title = "Domestic water wells drive drilling",
    subtitle = str_wrap("In recent years most well drilling in Hays, Travis and Williamson counties has centered around drinking water (domestic), water-level monitoring and environmental soil boring. About 3,500 total wells were drilled between 2020 and 2023."),
    fill = "Proposed use",
    x = "Year of drilling", y = "Percentage of wells drilled"
  )

ggsave("figures/wells_by_yr_type_plot.png")
Saving 7 x 5 in imagewells_by_yr_type_plot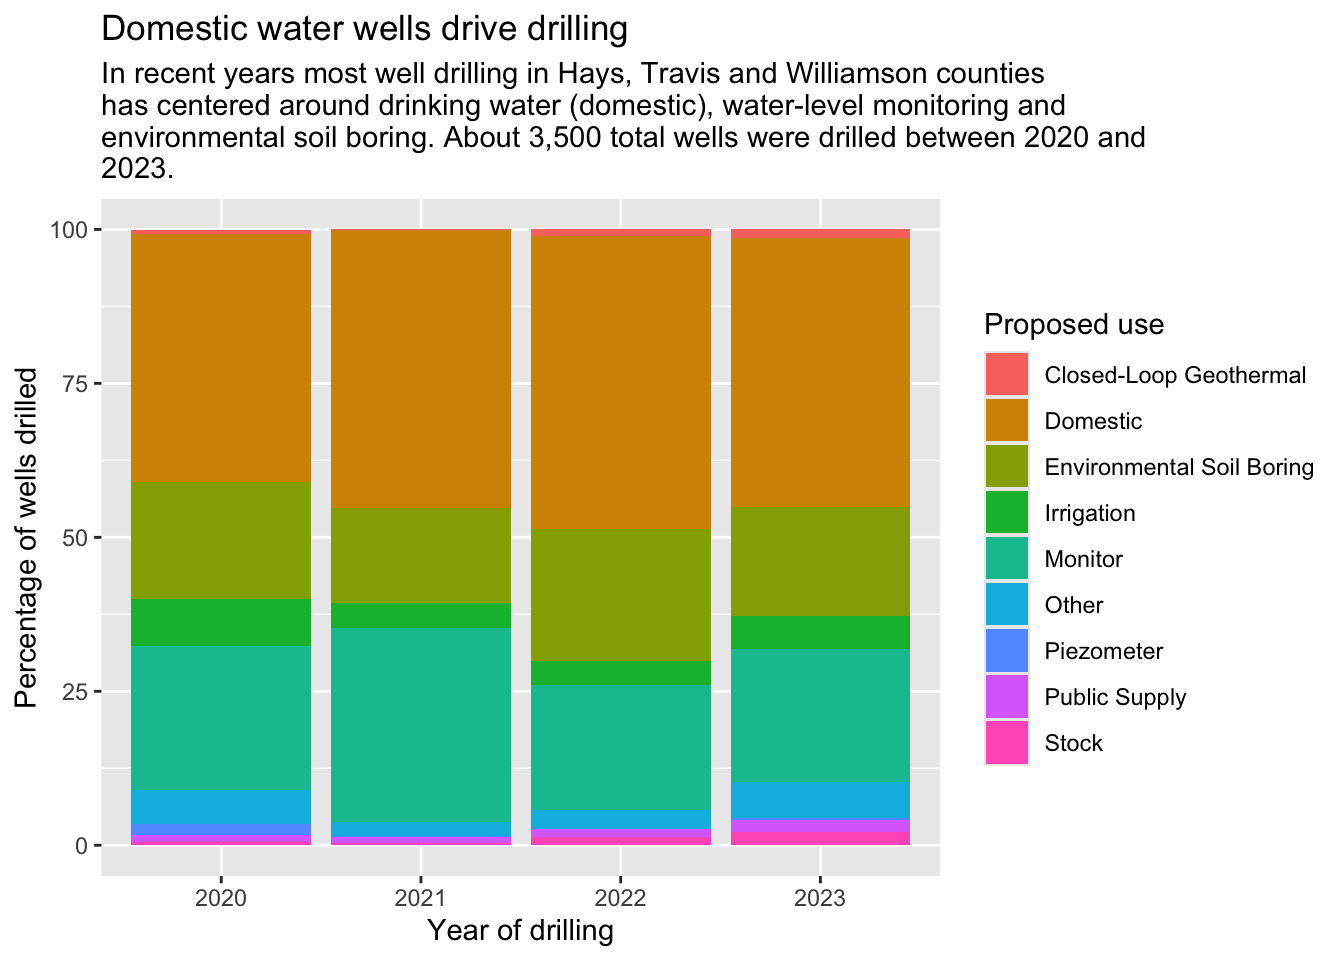
14.2.8 More in janitor
Believe it or not, there are more useful tools in the janitor package to clean your data. Check out the vignette.