26 Data and loops
We’re going to create the Pirate Ships page we added to our nav earlier and introduce some data to our project and build some loops to display that data.
26.1 Create a new page
- Create a new page inside
src/calledpirate-ships.njk. - Add the following code:
{% extends '_templates/base.njk' %}

{% block page_title %}Pirate ships{% endblock %}

{% block page_description %}A list of pirate ships of lore from fact and fiction.{% endblock %}

{% block content %}
<article class="container">
  <h1>Ships of the Golden Age of pirates</h1>
  <p>Intro text here.</p>
</article>
{% endblock %}- Save the file and then test your navigation link to make sure it works. If it doesn’t, make sure you created the new file in the right folder. It should be right next to
index.njk.
26.2 Let’s add some data
OK, are you ready to jump into some advanced features here? We are going to introduce a concept where we have a Google Sheet to manage the editing of data, but then we’ll “fetch” that data into our project so we can use it in the next step.
26.2.1 The data source: Google Sheets
I have already created a Google Sheet of pirate data. Click on that link so you can take a look at it. Imagine you are in a newsroom and many reporters are gathering data for your project. You could share a Sheet like this with them and they could edit it and create new rows of data. It’s a good way to keep track of stuff.
Our next trick is to tell our project here to download that data and format it in a way that we can use it. That file type we want in the end is called JSON, or JavaScript Object Notation. JSON is just “data” for JavaScript. There is a feature built into this project where we can download this data and translate it. One thing to know is the Google Sheet needs to be shared so that “anyone” can view it.
Here we will “tell” this project about the Google Sheet.
- Open the file in your project called
project.config.json. - After the closing
}on line 12, we are going to add the following code:
,
    {
      "fileId": "1G-aJA1H5C-B05Hlpx2RiojYcsNNXQ5ntvUEArRZ5O6w",
      "type": "sheet",
      "name": "pirates"
    }
That first comma in the code above needs to come right after the } that closes out the “bookstores” configuration.
The fileId value there is from the URL of the Google Sheet. It’s the long string before /edit/ in the URL, and it is unique to for every Google Sheet (and Doc, for that matter.). The type is “sheet”. the other possible value is “doc”. We’ll do one of those later. The name is what we want the file to be called when it is downloaded.
What we’ve done here is add to a “files” array in this JSON config file. This is a list of all the Google Sheets and Docs used in the project.
Before we can download the data we have to stop our browsersync process and run a new one to fetch our data.
- Go to your Terminal and do Control-C to stop the browsersync.
- Run
gulp fetch. “gulp” is our command and “fetch” is our task.
The result of the command should download three files. (Two were already in the config – library & bookstores – and we just added the new one “pirates”.)
This downloaded all the files to the src/_data/ folder.
If you have a problem with gulp fetch and get an error, you can use these steps to download the data. Do that and then move on with the rest of the lesson, but reach out to me to see if we can fix the problem.
Go ahead and open the files at src/data/pirates.json and peek at it. Here is just a snippet:
{
  "ships": [
    {
      "ship_name": "Queen Anne’s Revenge",
      "captain": "Edward \"Blackbeard\" Teach",
      "blurb": "Edward \"Blackbeard\" Teach was one of the most feared pirates in history. In November 1717, he captured La Concorde, a massive French ship used to transport enslaved people. He refitted the Concorde, mounting 40 cannons on board and renaming her Queen Anne's Revenge. With a 40-cannon warship, Blackbeard ruled the Caribbean and the eastern coast of North America. In 1718, the Queen Anne's Revenge ran aground and was abandoned. In 1996 searchers found a sunken ship they believe to be the Queen Anne's Revenge in the waters off of North Carolina: some items including a bell and an anchor are on display in local museums.",
      "source": "https://www.thoughtco.com/famous-pirate-ships-2136286"
    }
  ]
}
Inside this pirates.json file is an array called “ships”. Think of arrays as a collection of data. We could have more than one array in our file, but right now we only have one.
Inside our “ships” array we have eight items, one for each ship.
Each item (or ship in our case) has objects that are in key:value pairs. Our first “key” is ship_name and our first “value” is "Queen Anne’s Revenge".
I’ll try to keep all of these terms straight, but I admit I mix them up.
The key here is that we have downloaded this data, once we restart our dev environment the data will be “in context”, meaning our program will allow us to access it.
We need to build something to hold the data before we can explain how to use it.
26.3 Loops with data
Our aim here next is to use Bootstrap cards to create a list of pirate ships and their descriptions from our new data. If you open up those docs and peruse them you’ll see there are many different options and configurations. The one we are going to start with is Grid cards.
- Make sure
gulp devis running. - Go to the Grid cards section in the Bootstrap docs and copy the first code selection provided there.
- After the closing
</p>tag for the intro, add a new line. - Paste your code. This already has the row and columns we need.
- Save your file and look at your page.
It should look like this:
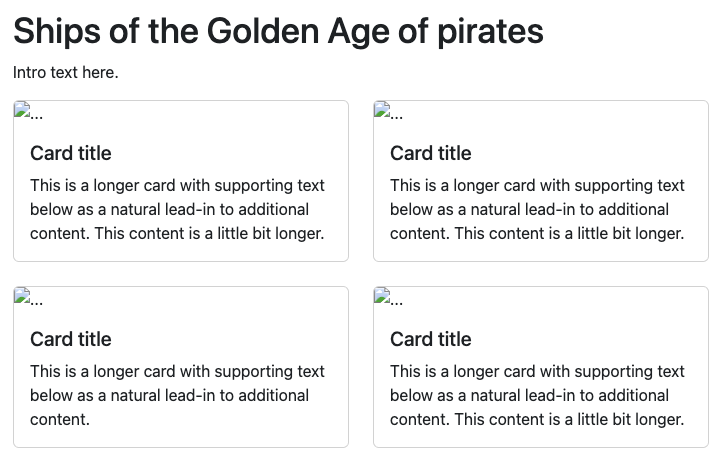
We now have four cards on our page with some issues, like our images are broken. We’ll fix those in a minute as we make other adjustments.
Our plan here is to have a card for each ship in our data. We could create eight cards and use our data inside each card, but what if we add more ships to our data source later? Instead, we’ll create a loop that writes a new card for each ship in our data.
Our Nunjucks templating system allows for loops like this because it is written in JavaScript. It might help to reference the Nunjucks documentation on “for” loops to see how they work.
We’re going to cut our template code down to a single working card, then set this up to repeat for each ship in our data.
- In the cards code, remove all but one of the col/cards. It starts with
<div class="col">and totals 9 lines of code. You want to make sure you still have even opening and closing divs for everything. If you save at this point and look at your page, it should have only one card but otherwise be the same. - Add a new line after the closing of the
<div class="row row-cols-1 row-cols-md-2 g-4">line. - Add the following to the new line:
{% for ship in pirates.ships %} - Add a new line right above the closing
</div>for the row. - Add the following to the new line:
{% endfor %} - Save your file and go look at your page.
That code should look like this, and descriptions follow:
  <div class="row row-cols-1 row-cols-md-2 g-4">
    {% for ship in pirates.ships %}
    <div class="col">
      <div class="card">
        <img src="..." class="card-img-top" alt="...">
        <div class="card-body">
          <h5 class="card-title">Card title</h5>
          <p class="card-text">This is a longer card with supporting text below as a natural lead-in to additional content. This content is a little bit longer.</p>
        </div>
      </div>
    </div>
    {% endfor %}
  </div>
Now you have eight cards! But how did it know we have eight ships? Let’s break down what we’ve done here.
Let’s take this line: {% for ship in pirates.ships %}
{% %}indicates we are doing special stuff, just like we’ve done before with “blocks” and “extend”.formeans we are starting the loop.shipis what we are calling a single pass through the data. We are “naming” that single item as a “ship” so we can refer later to key values in that row of data. We can use any word we want, but I always use a term logical to the data. We are looping through a bunch of ships, so a single one of those is a single “ship”.in pirates.shipsis defining which array we are looping through. The “pirates” part is the file we are looking in, and “ships” is the name of the array inside that file.- Everything after that will get repeated until we reach
(% endfor %)which says STOP REPEATING.
26.3.1 Remove the broken image link
While it would be cool if we had a photo of each ship to show here, we don’t, so we need to remove the image tag from the template code.
- Remove the line with the code:
<img src="..." class="card-img-top" alt="...">
That should remove that broken link from all the cards.
26.3.2 Update the headline
At this point you are thinking “That’s cool, Prof, but they are all the same.” Well, we can pull specific values from the data based on its key.
For the headline in the
<h5 class="card-title">tag, replace the text “Card title” with this:{{ ship.ship_name }}Save your file and go look at your page. Now you have a new ship name in each card.
To call a variable from our data, we use the double curly-brace:
{{ }}This is opposed to {% %} which does other things.
Since we named a single item a “ship” in our loop we use that, and then use the dot notation to call the object key:
{{ ship.ship_name }}I like to put spaces around the names for readability, but it is not required.
OK, now admit that’s kinda cool, right?
26.3.3 Update the blurb
If we look at our example JSON, we see the key for the description of the ship is called a blurb. So we can use the same style to replace the text in our code with the new value.
Go into the code and replace the text inside the
<p class="card-text">tag with:{{ ship.blurb }}Save and check your page.
Now you should be showing the description of each ship after the name of the ship.
26.3.5 Adding the captain
The last thing we need is to add our captain into the card. We don’t have an HTML element to update from our Bootstrap code, so we’ll just add our own.
- After the
<h5>line, add a new blank line. - In that new line, add an
<h6>and fill it with the code necessary to display the captain’s name. Refer to the JSON example above to figure out what the key value is. - Save and check.
26.3.6 Adjusting columns for breakpoints
The Grid cards example we pulled from the Bootstrap docs is set to show a single row of cards by default, then two cards per row at the md size and larger. Try making your browser smaller and larger so you can see the change.
On wider pages, we could show three cards next to each other, so let’s set that up.
- On the
class="row"line just above where the loop starts, add a new class to the ones already there that isrow-cols-lg-3. - Save and check how the cards behave now.
26.3.7 Fix some display nits
The cards are different heights depending on the content. We can adjust that by adding a class to the <div class="card"> element.
- Find that “card” element and add this class:
h-100
This sets the card height at 100% across each row. If you review the documentation, there are other little fixes like that you can make depending on your needs.
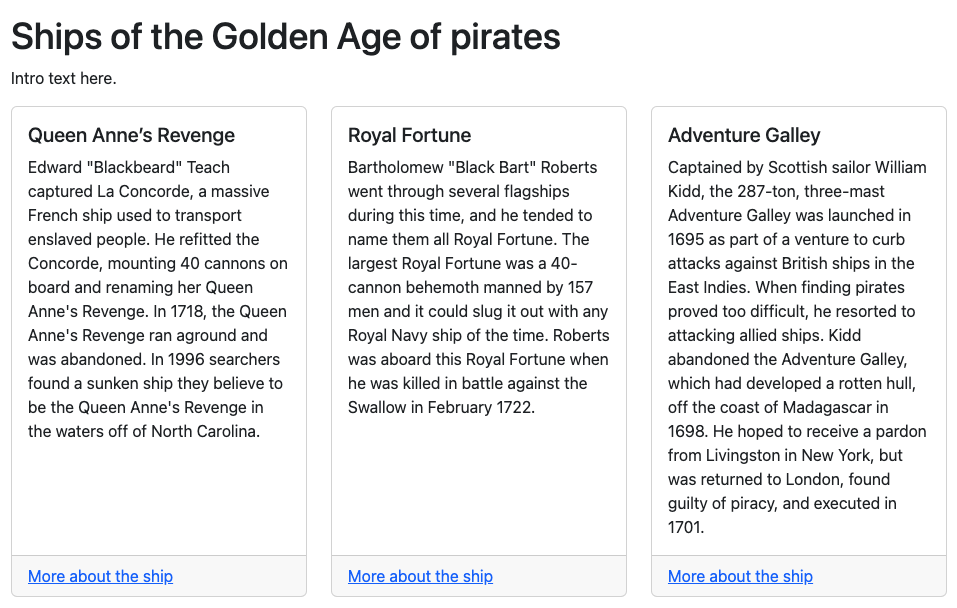
26.4 Card check
Your cards should now look like this at a “lg” window size: